
1. What Is an A/B Test in Rank Tracking?
An A/B Test helps you determine whether changes made to your website actually affected your search rankings, rather than external factors such as seasonality, search engine algorithm updates, or other market influences.
Here’s how it works: you select a test group of pages where changes were made and a control group of similar pages that remain unchanged. The system compares the performance of both groups before and after the selected date, isolating the impact of your changes from external trends.
Experiments can be created for two types of objects:
- Tags — groups of keywords already created within the project.
- URLs — individual pages tracked in the project.
2. When to Use an A/B Test
| Scenario | Is an A/B Test Suitable? |
| You updated content for some category pages while leaving the others unchanged. | ✅ Yes. The unchanged categories can serve as the control group. |
| You changed the URL structure for one section of your website. | ✅ Yes. The remaining sections can be used as the control group. |
| You updated the page titles across the entire website at once. | ⚠ Not recommended. Since there are no unaffected pages to use as a control group, a Before/After comparison is a better option. |
| You want to measure the impact of changes on individual pages rather than keyword groups. | ✅ Yes. Create the experiment in URL mode. |
3. Creating an Experiment
3.1 Open the Experiments Tab
Open the required Rank Tracking project and navigate to the Experiments tab. It is located in the top navigation bar next to Dynamics, Competitors, and History.
If no experiments have been created for the project yet, you’ll see an empty screen with a Create Your First Experiment button.
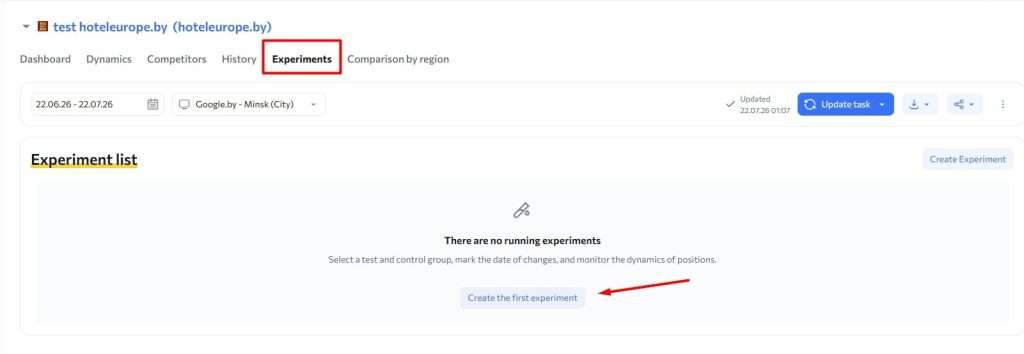
Click the button to start configuring a new experiment.
3.2 Configure the Experiment
Complete the following fields in the setup dialog.
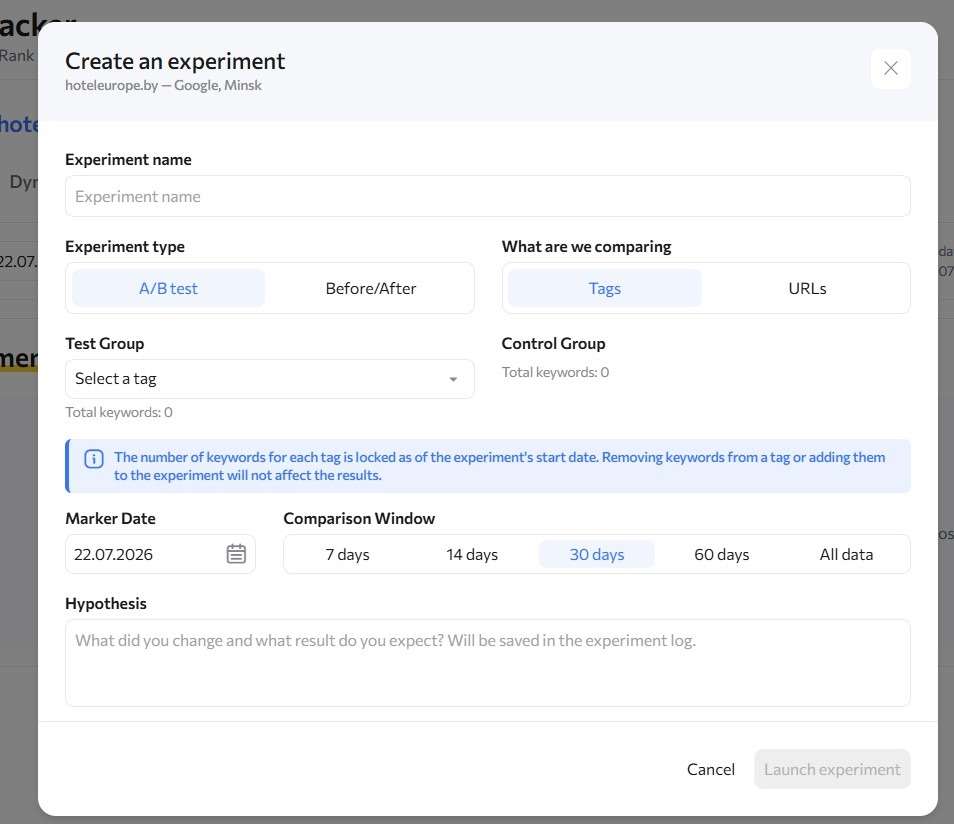
Step 1. Select the Experiment Type
Choose Group A/B Test to compare a test group with a control group.
Step 2. Enter a Name
Give your experiment a descriptive name. It will be displayed in the Experiment Log and on charts.
For example:
Smartphone Category Content Optimization
Step 3. Choose What to Compare: Tags or URLs
Use the Compare By selector to choose the objects that will be included in the experiment.
- Tags — Select this option if you’re working with keyword groups. Choose a tag from the list of tags available in the project.
- URLs — Select this option if your changes affect specific pages. Choose one or more URLs from the list using the checkboxes.
The same tag or URL cannot be included in both the test group and the control group.
Step 4. Select the Test Group
The Test Group contains the tags or URLs where changes were made.
- Tags mode: Select one tag from the drop-down list.
- URL mode: Select one or more URLs using the search field and checkboxes.
Step 5. Select the Control Group
The Control Group should contain similar pages that were not modified. The more closely the test and control groups match in topic and structure, the more reliable the results will be.
- Tags mode: You can add multiple tags to the control group.
- URL mode: Search for URLs, select them using checkboxes, or click Select All.
If a tag is already used in another active experiment, the system displays a warning but still allows you to continue.
Step 6. Set the Marker Date
The Marker Date is the date when your changes were implemented.
By default, the system uses the date of the latest rank check, but you can select any date available in the project’s ranking history.
The Marker Date cannot be earlier than the first recorded rank check, as there would be no historical data for the Before period.
Step 7. Select the Comparison Window
The Comparison Window defines the period before and after the Marker Date that will be analyzed.
Available options:
- 7 days
- 14 days
- 30 days
- 60 days
- All Data
For SEO experiments, we recommend using a comparison window of 30 days or longer, as search engines typically respond to changes gradually.
Step 8. Add a Hypothesis (Optional)
Describe the changes you made and the outcome you expect.
The hypothesis will be saved in the Experiment Log, making it easier to remember the context of the experiment and explain the results to your team later.
Step 9. Start the Experiment
Click Start Experiment.
The system saves your settings and automatically opens the Results page.
If either the test group or the control group contains fewer than five keywords, the system displays a warning about low statistical significance.
You can still proceed by clicking Start Anyway.
When an experiment is launched, the system takes a snapshot of the keywords included in the experiment along with their search volumes.
Any keywords added later—or any additional keywords that begin ranking for URLs after the experiment has started—will not affect the experiment results. This ensures that the analysis remains consistent throughout the experiment.
4. Results Page
After creating an experiment, you’ll be taken to the Results page. It consists of three sections:
- Summary cards
- Charts
- Keyword table
4.1 Summary Cards
The four cards at the top of the page provide a quick overview of the experiment’s outcome.
| Card | Description |
| Test Visibility | The current visibility of the test group, along with the change from the Marker Date to the present. Displayed as: X% → Y%. |
| Control Visibility | The same visibility metric for the control group, allowing you to compare its performance against the test group. |
| Net Effect | The primary experiment metric. Calculated as the change in the test group minus the change in the control group. It represents the impact of your changes after eliminating background market trends. |
| Observation Period | The number of days since the Marker Date, along with the number of rank checks performed during that period. |
The Net Effect card is the most important metric.
For example, if the visibility of the test group increased by 15% while the control group also increased by 12% (for example, due to seasonality), the actual impact of your changes is only 3%.
4.2 Charts
The Results page includes three chart tabs:
- Visibility
- Average Position
- Top 10 (%)
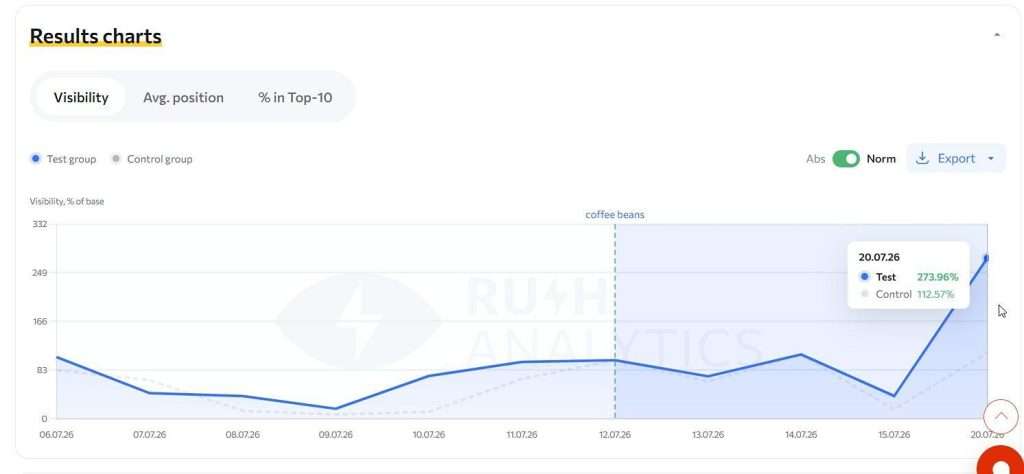
Each chart displays the performance of the test group (solid blue line) and the control group (gray dashed line) on the same timeline.
Chart Elements
- Blue vertical dashed line — the Marker Date, separating the Before and After periods.
- Gray background — the period before the Marker Date.
- Light blue background — the period after the Marker Date.
- Existing project notes are displayed as annotations on the chart.
Charts can be exported in PNG and PDF formats.
Display Modes
Use the Absolute / Normalized toggle in the upper-right corner of the chart to switch between display modes.
Absolute
Displays the actual metric values. Use this mode to evaluate the real performance level of each group.
Normalized
Displays normalized values, using the metric value on the Marker Date as 100% for both groups.
This makes it possible to compare trends accurately, even when the test and control groups have significantly different baseline values.
Normalized mode is selected by default.
Use Normalized mode when the test and control groups differ significantly in size—for example, a tag containing 200 keywords compared to one containing 30 keywords. In Absolute mode, the chart lines may not be visually comparable.
For the Average Position metric, values below 100% in Normalized mode indicate an improvement, since a lower ranking position means a higher placement in search results.
A reminder of this behavior is displayed below the chart.
Exporting Charts
Use the PNG and PDF buttons to export the chart exactly as it is currently displayed, including the selected metric and display mode.
4.3 Keyword Table
The Keyword Table displays all keywords included in the test group and their ranking changes over the course of the experiment.
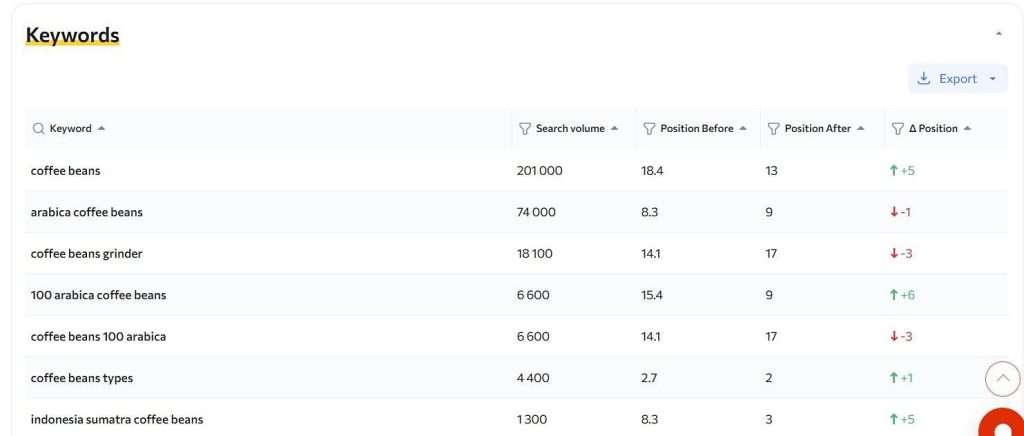
The table contains the following columns:
- Keyword — A keyword from the test group.
- Search Volume — The keyword’s search volume from Wordstat.
- Position Before — The average ranking position during the seven days before the Marker Date.
- Position After — The ranking position recorded during the most recent rank check.
- Position Δ — The change in ranking position. Green indicates an improvement, while red indicates a decline.
By default, the table is sorted by the absolute value of the position change, with the keywords showing the largest ranking changes displayed first.
To refine the displayed data, use the standard column filters.
The table can be exported in XLSX and CSV formats.
The exported file includes all rows that match the current filter settings.
5. Experiment Markers on Project Charts
The experiment’s Marker Date is automatically displayed on all standard charts in the Dynamics tab as a blue vertical dashed line.
Hover over the marker to see a tooltip displaying the experiment name and Marker Date.
Click the marker to open the corresponding Results page.
If a project contains multiple experiments with different Marker Dates, all experiment markers are displayed on the chart simultaneously.
6. Experiment Log
All experiments created within a project are stored in the Experiment Log. Once at least one experiment has been created, the Experiment Log becomes the default view of the Experiments tab.
Each experiment entry includes:
- Experiment Name — Click to open the experiment’s Results page.
- Experiment Settings — The experiment type, test group, control group, Marker Date, and experiment duration.
- Status — Active or Completed.
- Net Effect — The overall measured impact of the experiment.
- Actions — Edit settings, download results, or delete the experiment.
The following filters are available:
- All
- Active
- Completed
These filters allow you to display only the corresponding experiments.
The counter displayed in the page header always shows the total number of experiments, regardless of the selected filter.
7. Completing an Experiment
7.1 Manually Completing an Experiment
You can complete an experiment in one of two ways:
From the Results page: click Complete Experiment in the upper-right corner.ardless of the selected filter.
From the Experiment Log: click ⋯ next to the experiment and select Complete Experiment.
Frequently Asked Questions
What happens if I delete a tag after creating an experiment?
The experiment data is preserved.
When an experiment is created, the system takes a snapshot of the keywords included in the selected tag, along with their search volumes, as of the Marker Date.
Any changes made to the tag afterward do not affect the experiment results.
Can the same tag be used in multiple experiments?
Yes.
The system displays a warning during setup but does not prevent you from creating the experiment.
Keep in mind that running multiple experiments using the same tag may influence the interpretation of their results.
Why is Normalized mode enabled by default?
The test and control groups often differ significantly in size and visibility.
In Absolute mode, one group may have visibility values several times higher than the other, making trend comparison difficult.
Normalized mode uses the metric value on the Marker Date as the common baseline (100%) for both groups, allowing you to compare changes over time regardless of their initial values.
What is the minimum amount of data required to build a chart?
A chart requires at least:
- 2 rank checks before the Marker Date, and
- 1 rank check after the Marker Date.
If there is insufficient data, an informational message is displayed instead of the chart.
What is the Net Effect, and why is it more important than the test group’s visibility growth?
Visibility can increase for reasons unrelated to your website changes, such as seasonality, search engine algorithm updates, or overall market growth.
The Control Group helps account for these external factors.
The Net Effect is calculated as:
Net Effect = Test Group Growth − Control Group Growth
This metric represents the actual impact of your changes after eliminating background market trends.
Example
- Test Group visibility: +15%
- Control Group visibility: +12%
Net Effect = +3%
This means your website changes contributed 3% of the overall growth, while the remaining 12% resulted from external market factors.