Step-by-step guide to working with the reputation management tool:
Create a task.
To create a task, go to the SERM tab and click “Create new task”.
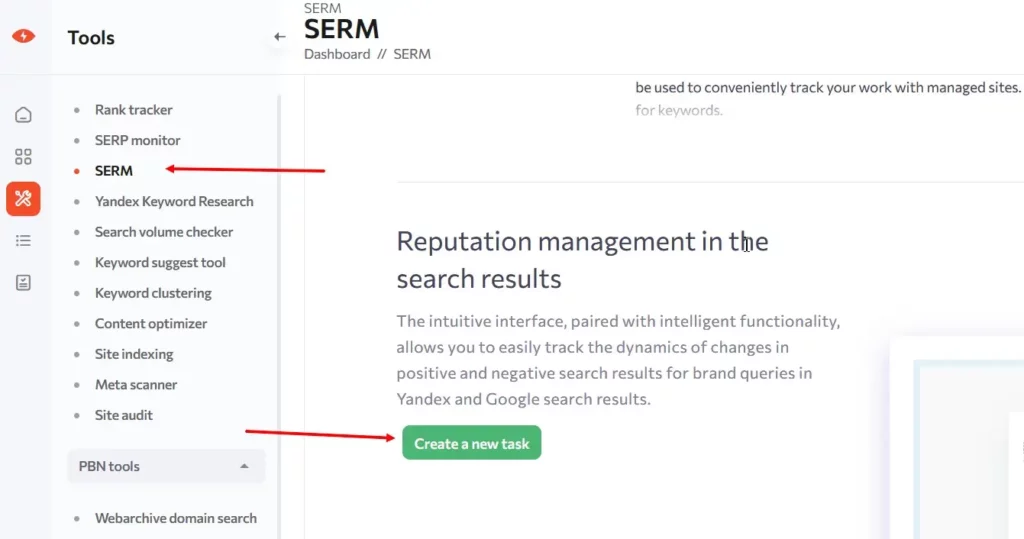
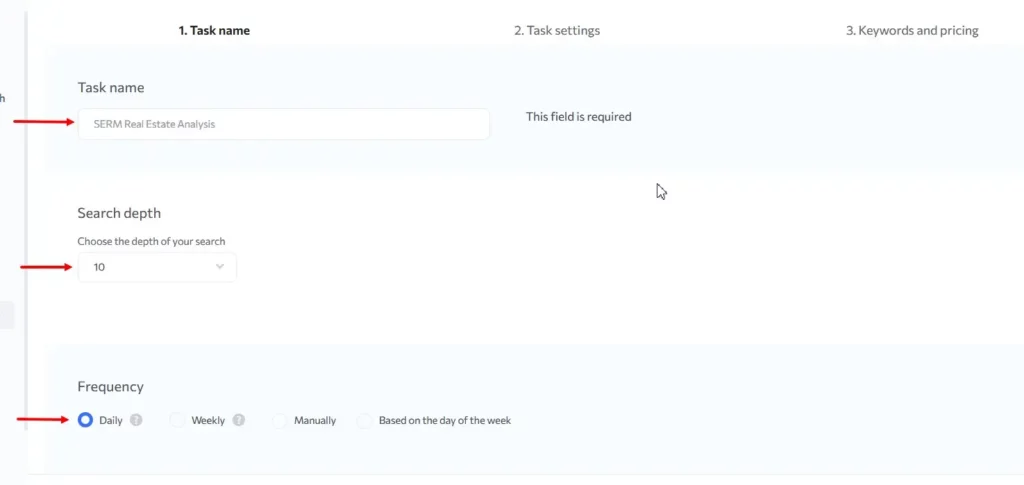
Step one: Task name
Here you need to enter a task name (mandatory field). You can enter any name. It is often convenient to enter the name of a company or a brand to make it easy to find the right task in the future.
Next, select the depth of the TOP you would like to collect for analysis:
TOP 10
TOP 20
TOP 30
TOP 50
TOP 100
The depth of the TOP depends on the cost of the task.
Then, you need to select the data check frequency:
Daily – data will be checked every day.
Weekly – data will be checked once a week.
Manually – data will be checked when you start collecting it manually.
By days of the week – data will be checked by selected days.

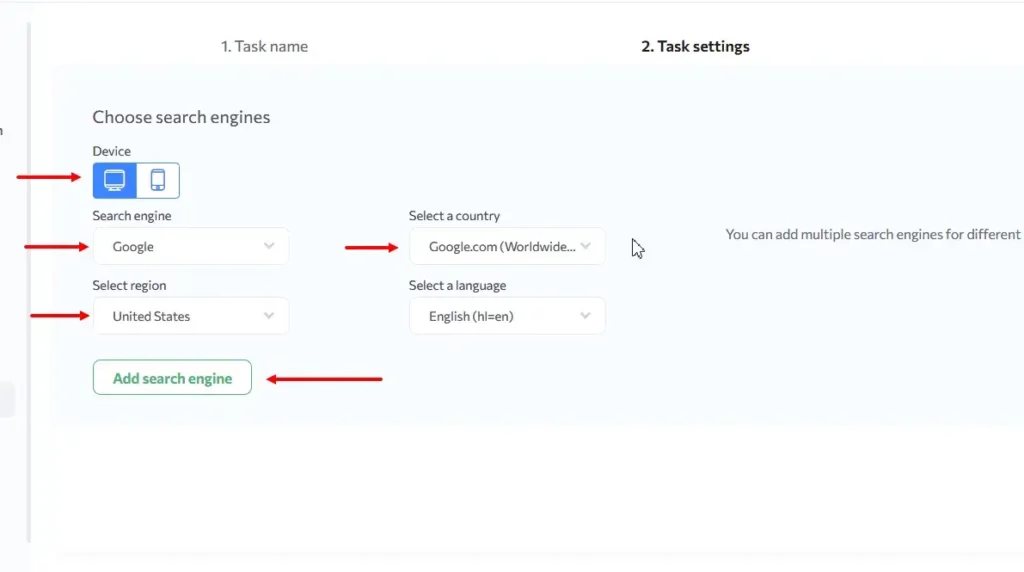
Step two: Task settings
Here, you need to select the device for which you want to collect the results and the search engine. You can select Google and Yandex.
You can add an unlimited number of regions to the task.

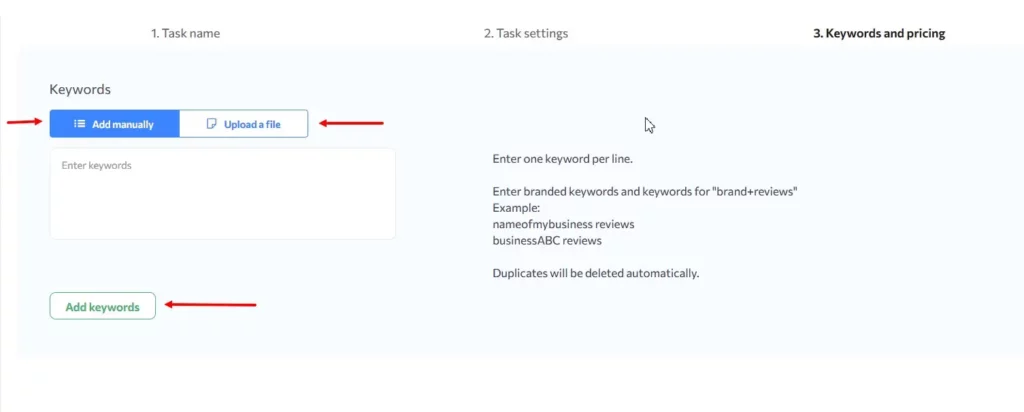
Step three: Keywords
Here, keywords can be uploaded in the interface field as well as via a file. Enter name brand keywords and brand + reviews keywords.
For example:
rush analytics employee reviews
rush analytics reviews
Enter keywords, each word on a new line. Duplicate keywords will be removed automatically.

Click “Start task” and your task will be sent to collect data from the search results.
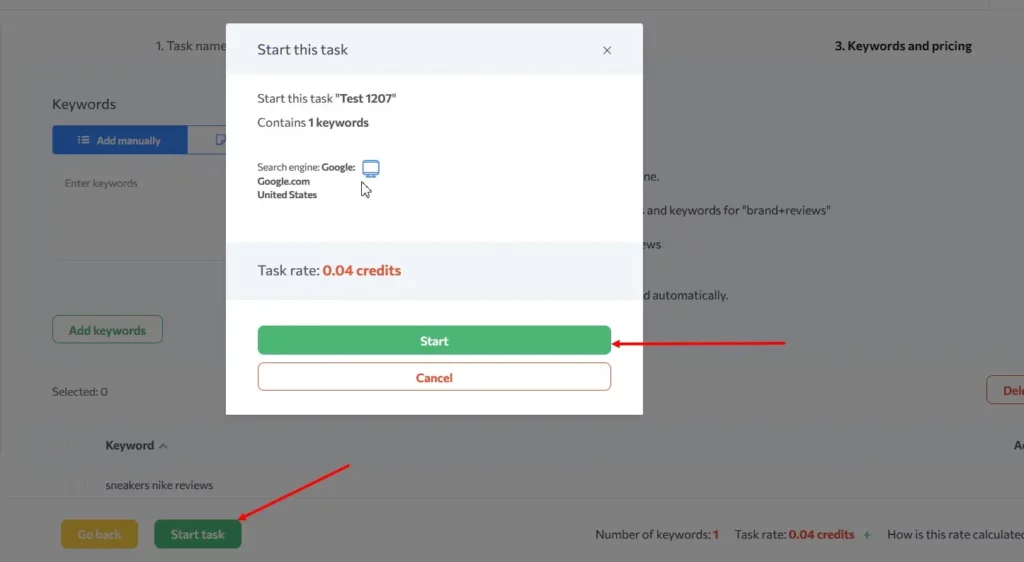
You can monitor the status of a task in the Queue tab or the task list of the SERM tool.
Guide to using the web interface
Go to the web interface of the task
To go to the task results, you need to click on the task name in the SERM tool’s task list.
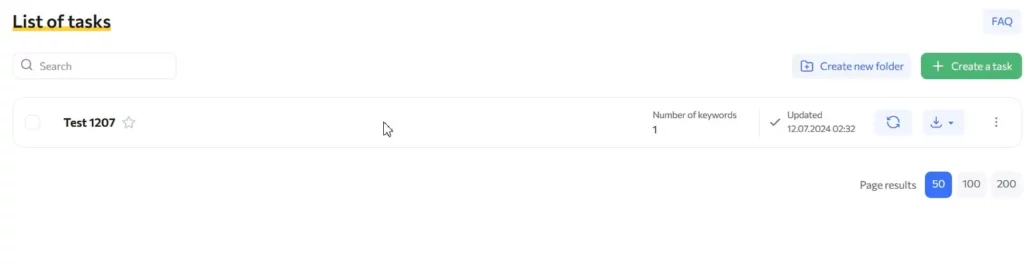
In the task web interface, you can view data, download a report, update the task, and go to edit the task.
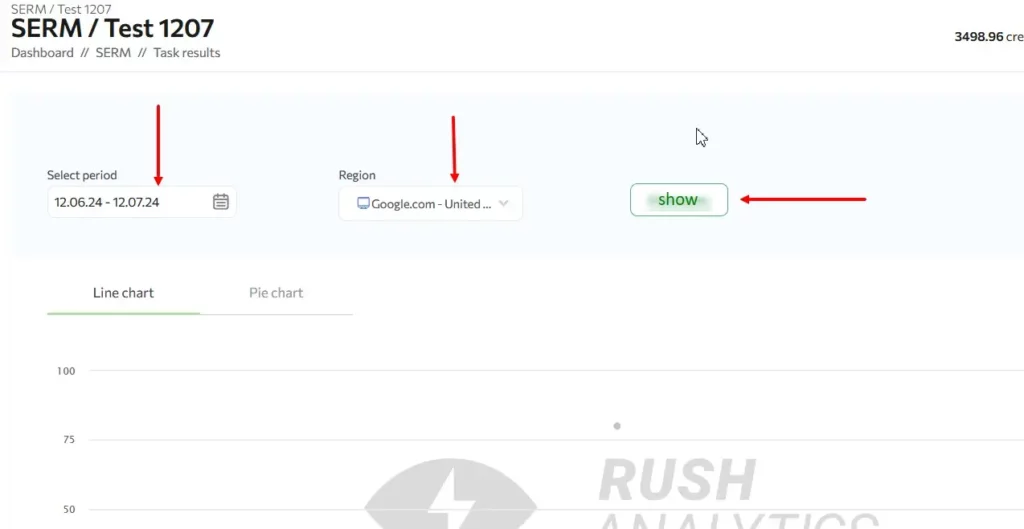
You can view the data by the following parameters:
Data collection period
Source – Google or Yandex search engine.
Region – displays the data of the selected region.
To view the data on the selected parameters, select them and click on the “Show” button.
Task results
The task results show the data in graphs (line graph and pie chart) and a table.
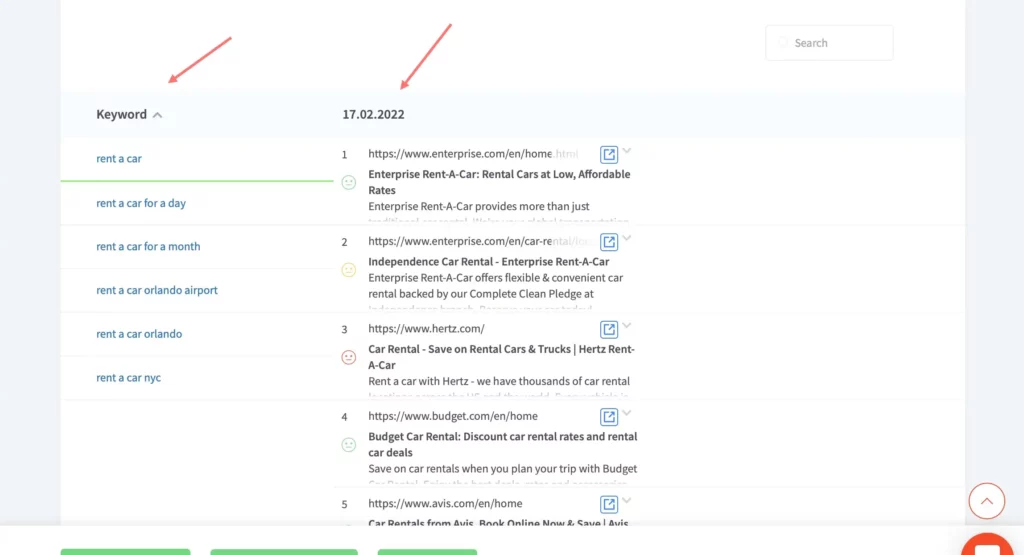
Table
The “Keyword” column displays the keywords loaded in the task. When you click on a keyword in this column, the right side of the table will open the TOP for the selected keyword. The selected keyword is highlighted with a green line.
The output for the selected keyword is displayed by the date of data collection. The table shows only the first 10 results for the selected period. The dynamics for more dates will be in the report.
When hovering over a URL, a highlighting will appear which highlights that URL for all the dates of the checks.
Positive
Neutral
Unmarked
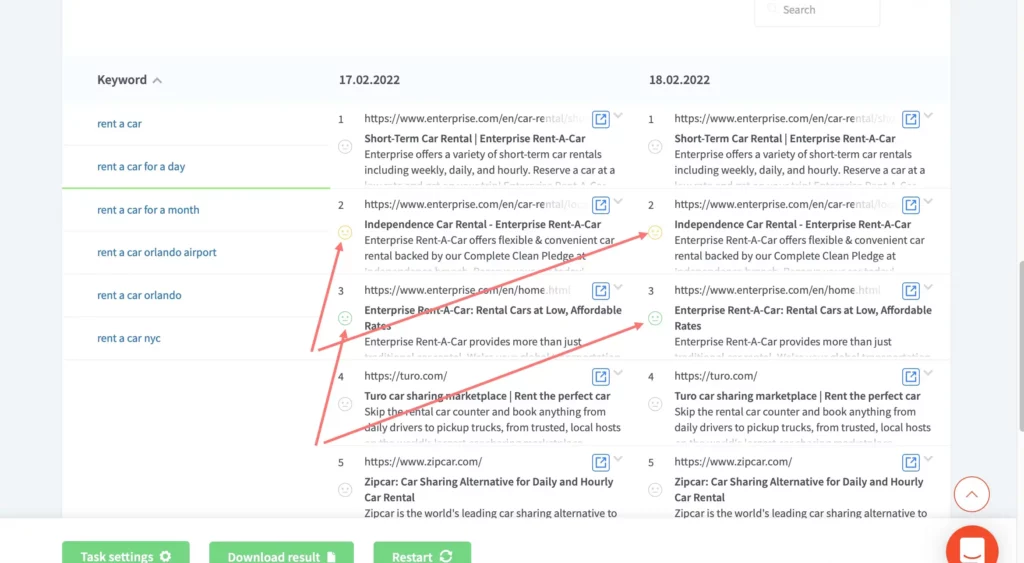
To mark the data in the table, you need to click on the smileys next to each URL of the search results. One click is positive, two clicks are neutral, three clicks are negative, and four clicks are unmarked.
If you mark up the URL of the first date with any smiley, the markup will also be reflected in the URL in later checks.
If you mark up the second and later checks, the markup of the first date will remain unchanged.
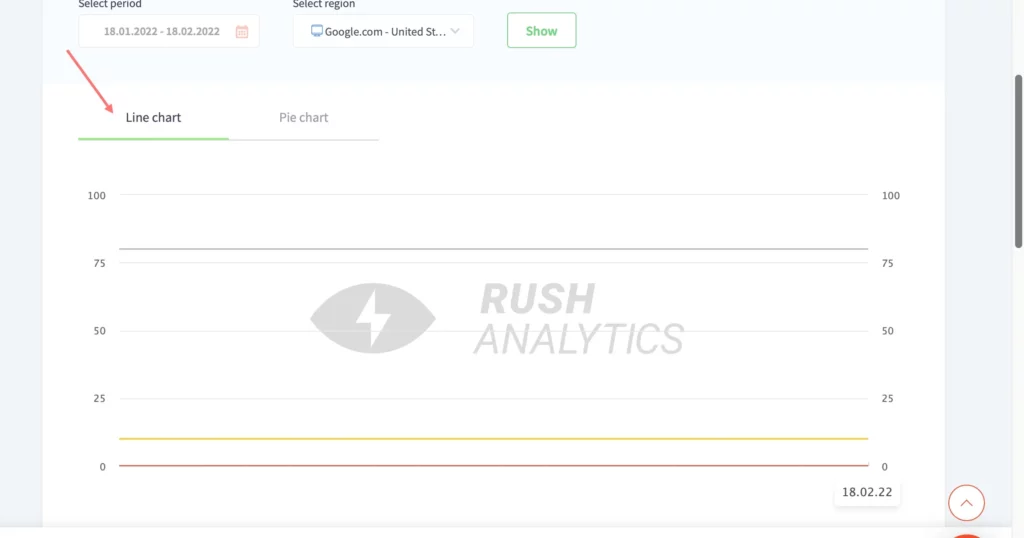
Line graph
The line graph shows the tone dynamics for the keyword selected in the table.
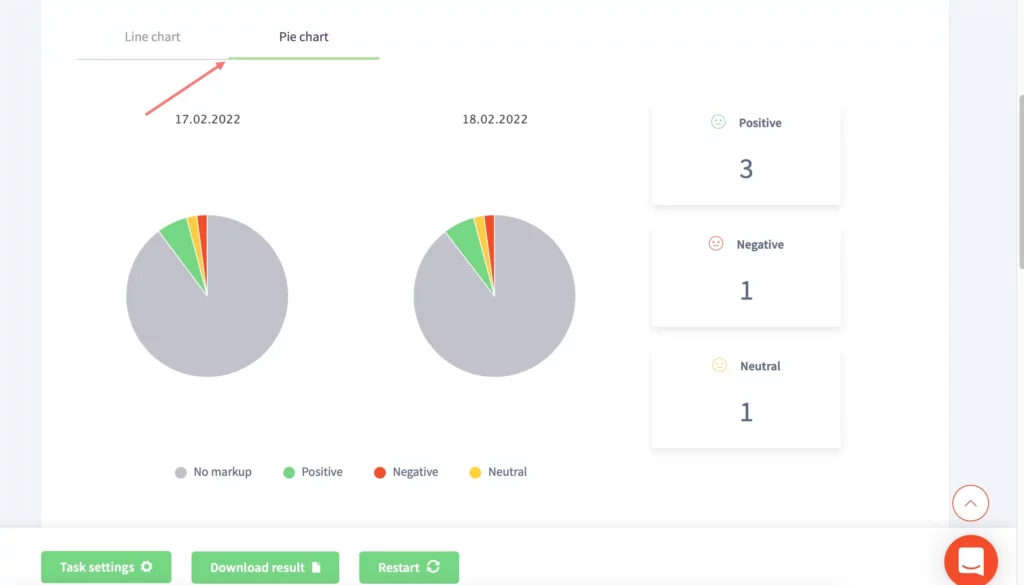
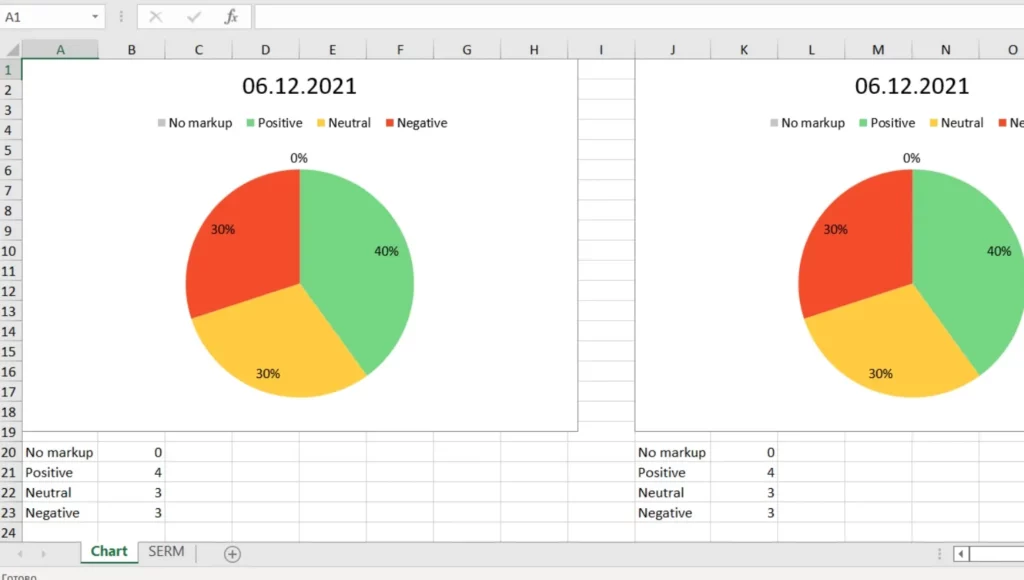
Pie Chart
The pie chart shows the data for all the marked output URLs. The first diagram shows the number of URLs marked in the first check, and the second diagram shows the number of URLs marked in the last check.
How to work with task editing
When editing tasks, you can change:
the name of the task
the depth of data collection (TOP)
the frequency of data collection
Search engines:
You can add and delete regions here.
Keywords:
Here you can add or delete keywords.
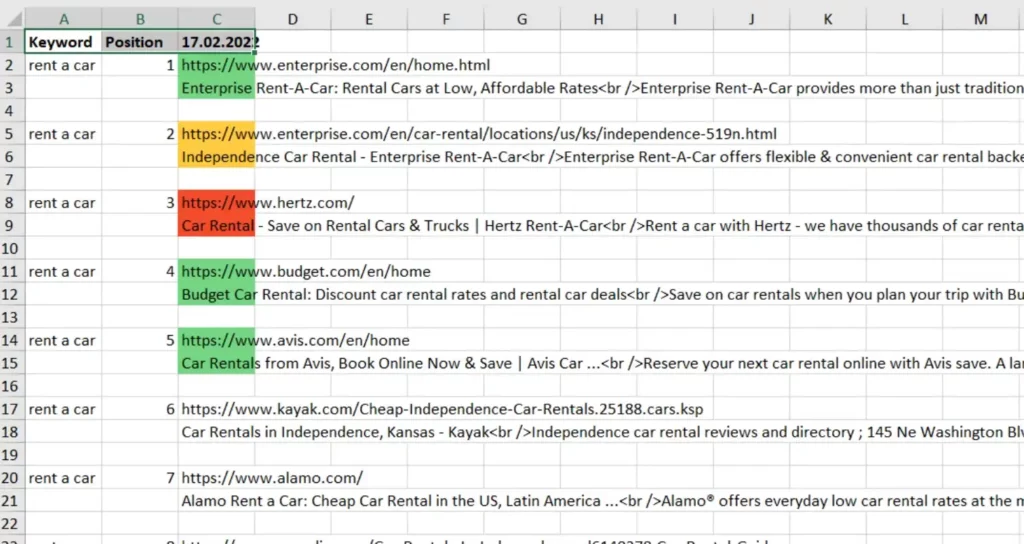
SERM file report
This file shows the results for the period selected in the task.
The Chart tab displays two charts with data for all marked output URLs. The first graph shows the number of URLs marked up for the first check, and the second graph shows the number of URLs marked up for the last check.
The SERM tab displays the keywords and search results for them. The URLs marked in the task are also color-coded in the file for this purpose.
Is this article helpful?
 183
183
 46
46