Step-by-step guide to using the SERP checker tool:
Create a task.
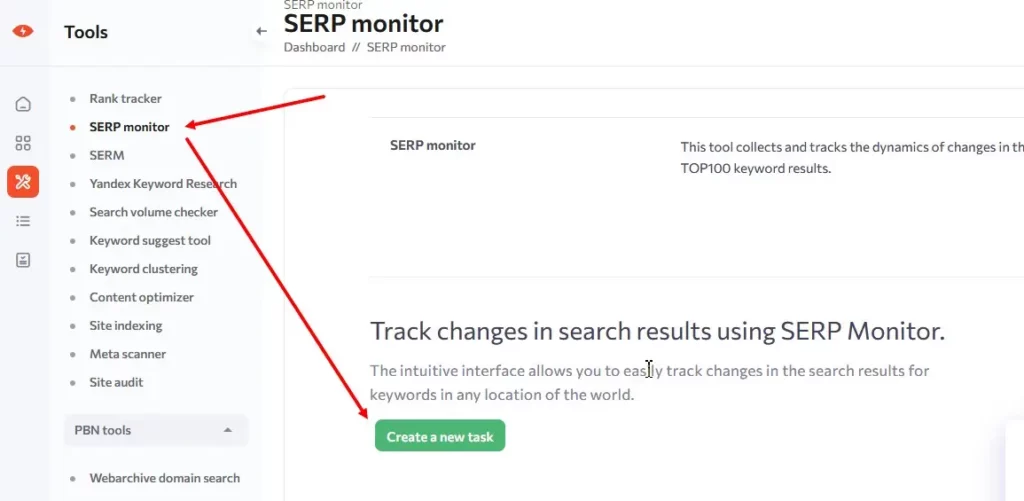
To create a task, go to the “SERP monitor” tab and click “Create new task”.
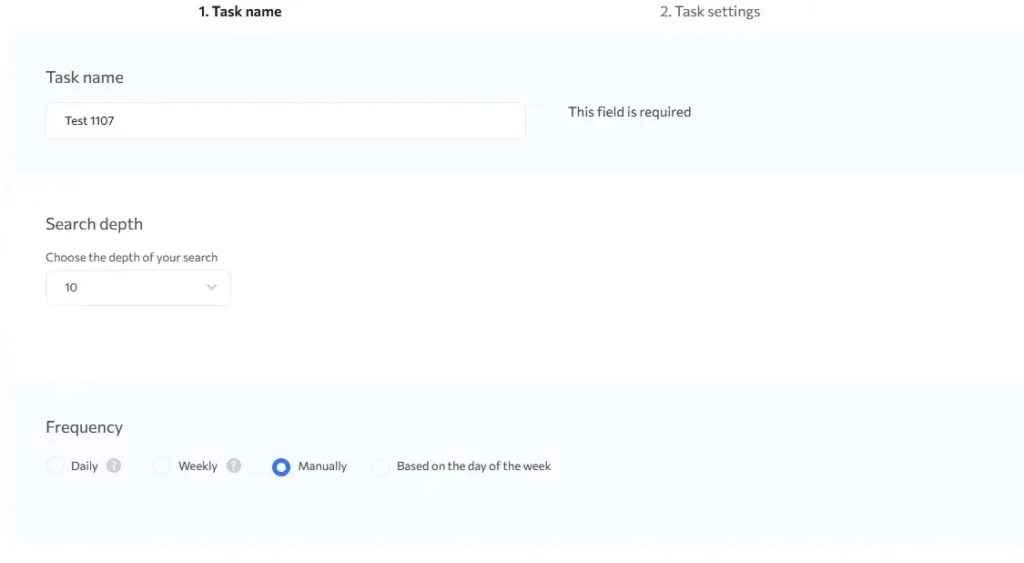
Step one: Task name
Here you need to enter a task name (mandatory field). You can enter any name. It is often convenient to enter the main keyword so that you can easily find the right task in the future.
Next, select the depth of the TOP you would like to collect for analysis:
TOP 10
TOP 20
TOP 30
TOP 50
TOP 100
The depth of the TOP affects the cost of the task.
Then, you need to select the frequency of data collection:
Daily – data will be collected every day.
Weekly – data will be collected once a week.
Manually – data will be collected when you launch a task manually.
By days of the week – data will be collected according to the selected days.

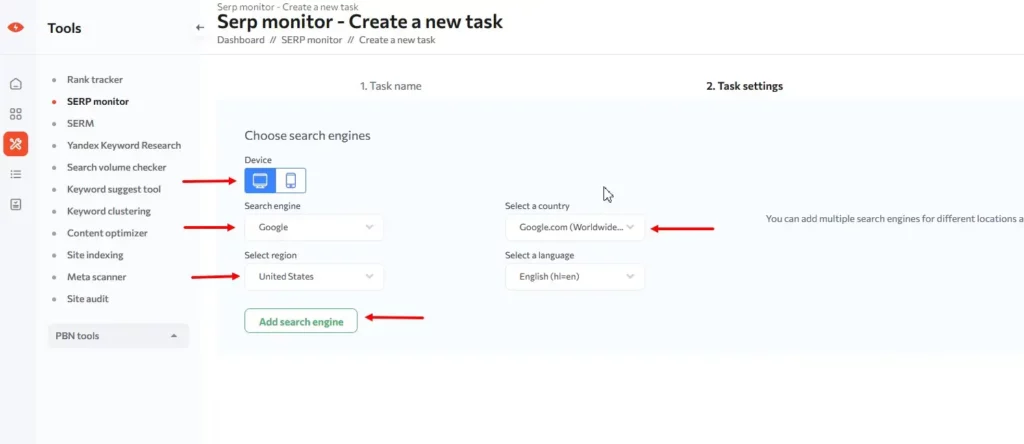
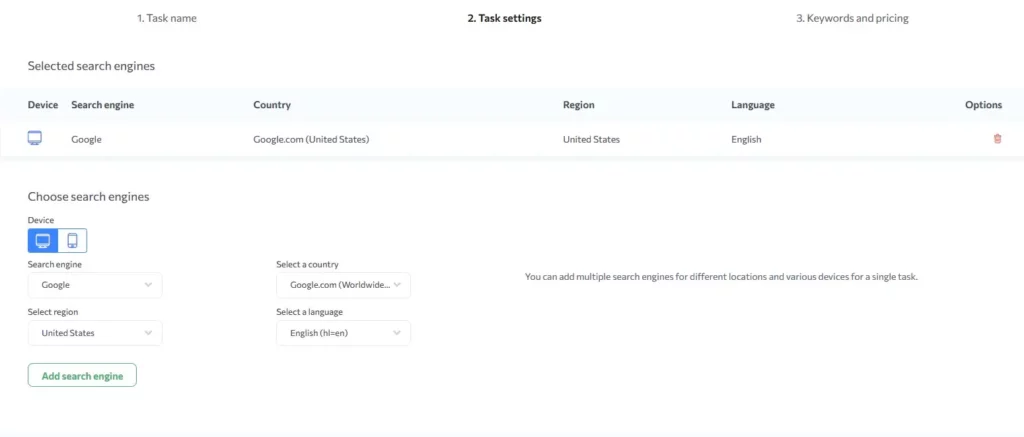
Step two: Task settings.
Here, you need to select the device for which you want to collect the results and the search engine. You can select Google and Yandex.
You can add an unlimited number of regions to the task.
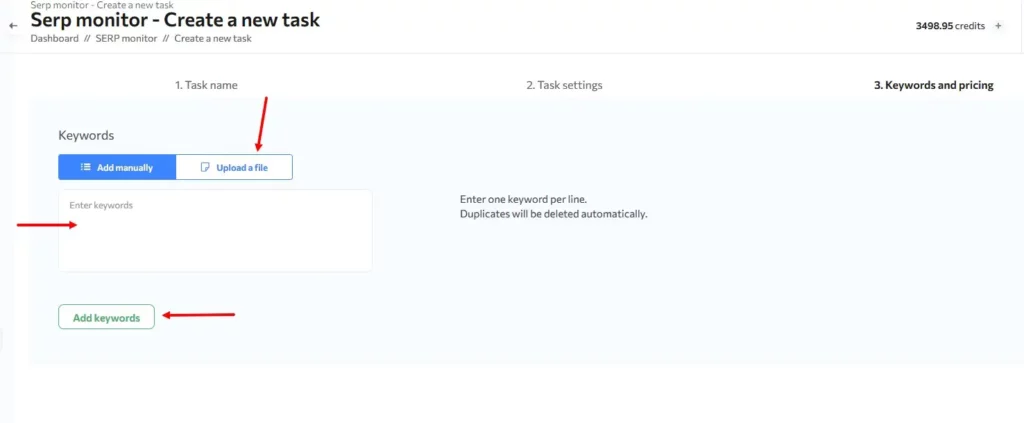
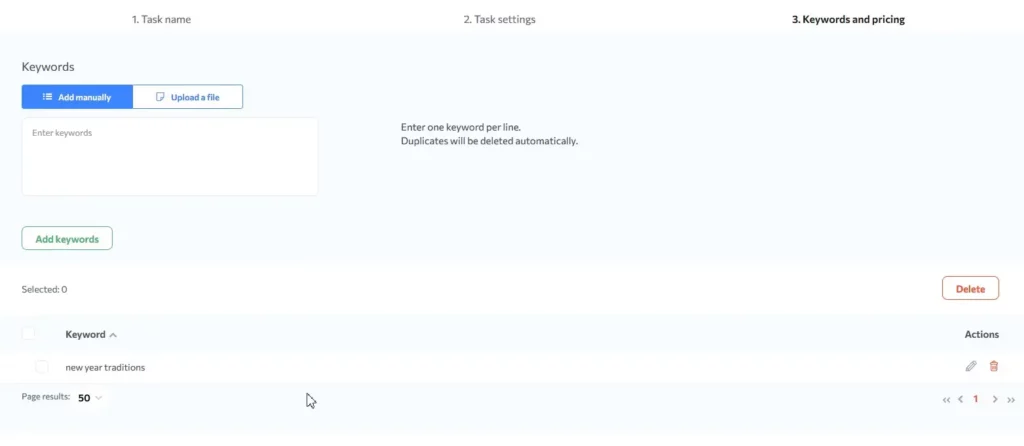
Step three: Keywords
Here, it is possible to load keywords in the interface field as well as via a file.
Click “Start task”. Your task has been sent to collect data from the search engine results.
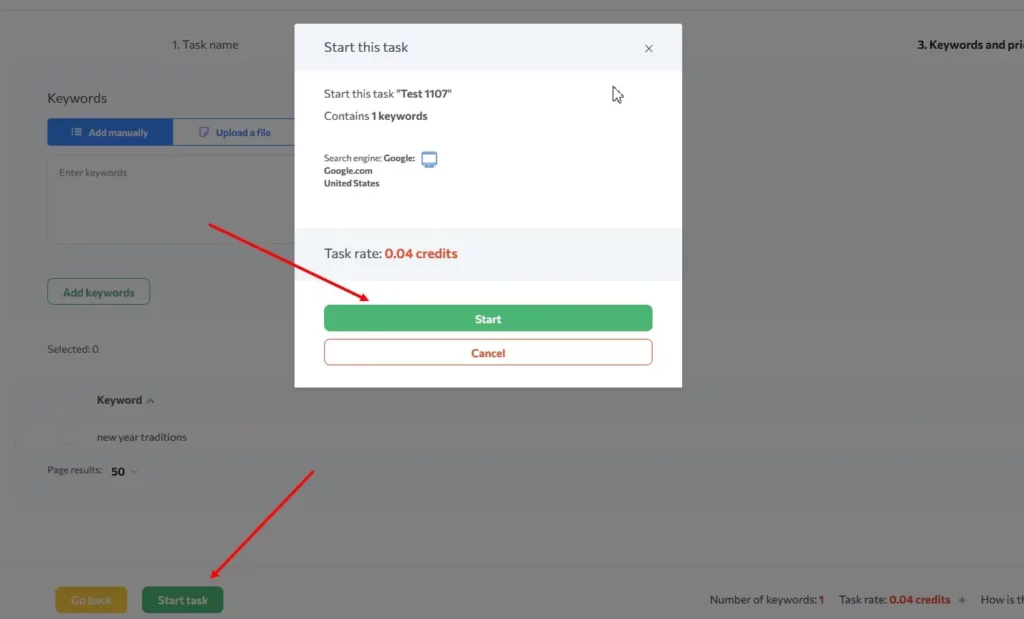
You can track the status of a task in the “Queue” tab or the task list of the SERP monitor tool.
Guide to the web interface
To go to the task results, you need to click on the task name in the task list of the SERP monitor tool.
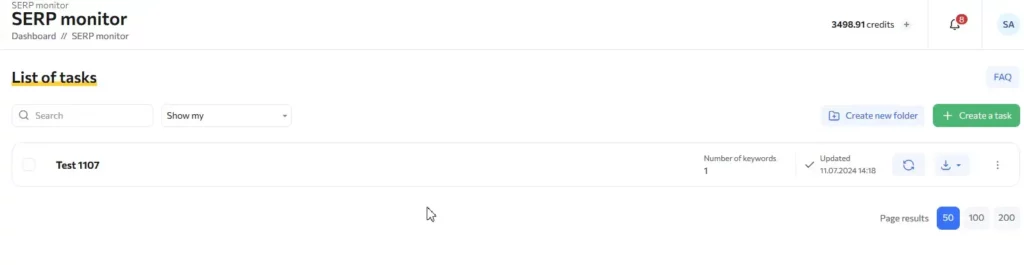
In the web interface of the task, you can edit the task, download a report with data, update the task and view the data.
The data can be viewed by the following parameters:
Data collection period
Source – Google or Yandex search engine
Region – shows data from a selected region
To view the data by the selected parameters, press the “Show” button.
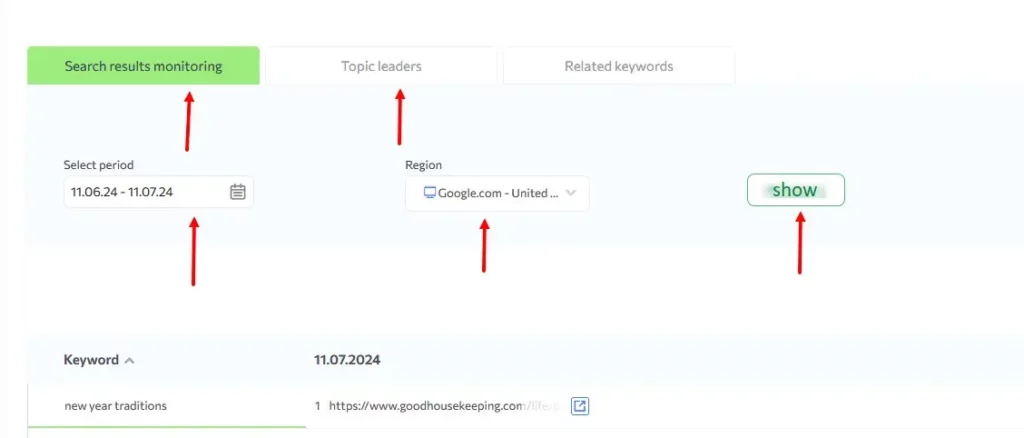
Search results monitoring tab
In the table, you can see the search engine results for the keywords.
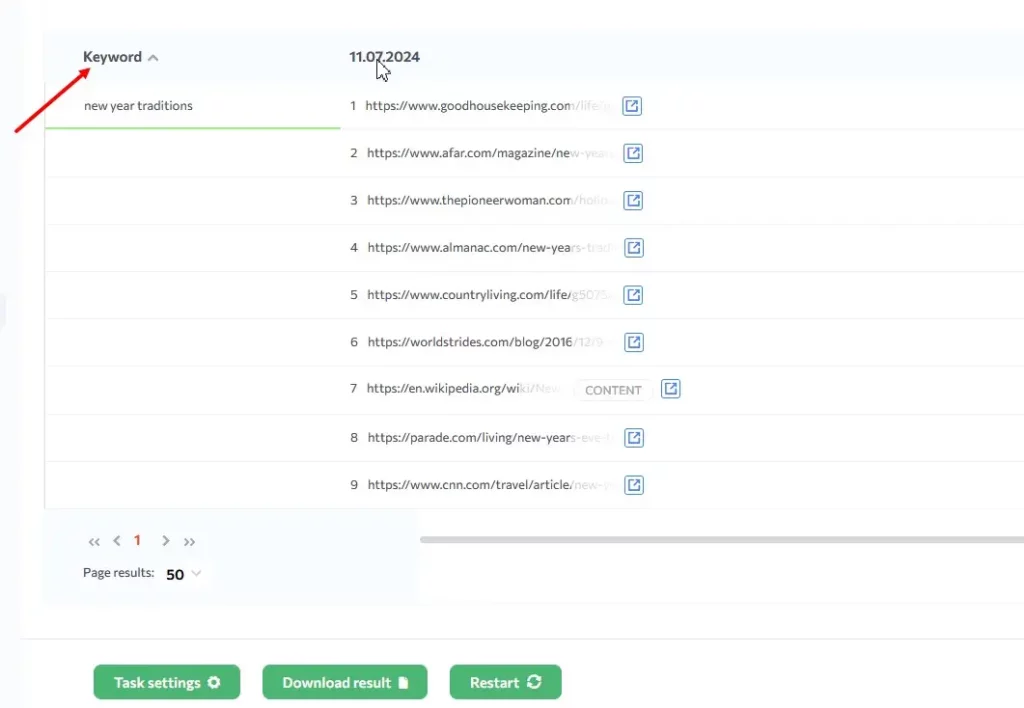
The “Keyword” column displays the keywords loaded in the task. When you click on a keyword in this column, the right side of the table will open the TOP for the selected keyword. The selected keyword is highlighted with a green line.
The results for the selected keyword are displayed according to the data collection dates. The table shows only the first 10 results for the selected period. The dynamics for more dates will be in the report.
When hovering over a URL, a highlighting will appear which highlights that URL for all the dates of the checks.
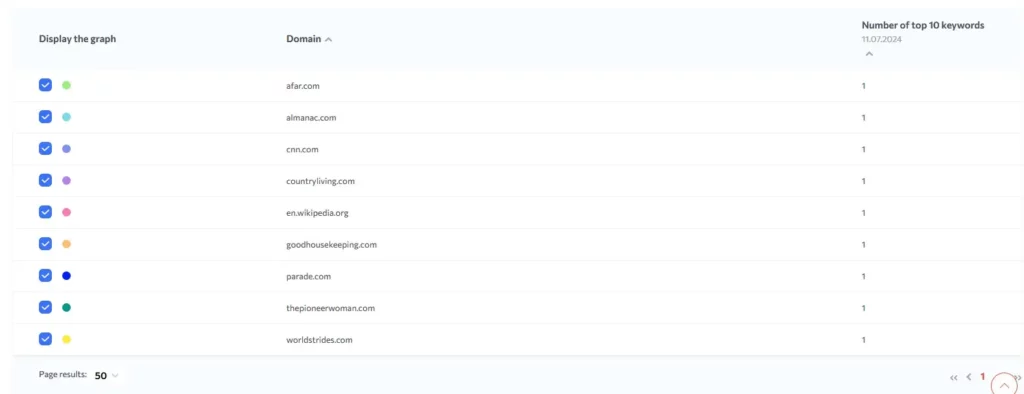
Tab Topic leaders
The Topic Leaders tab provides a summary report with a graph.
The graph shows the domains and the percentage of keywords in the top 10.
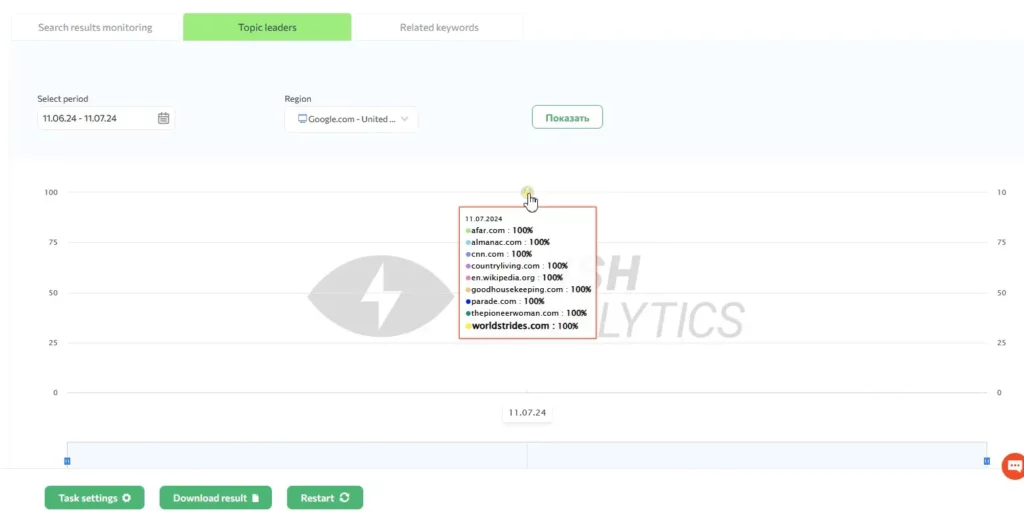
The table shows the domains and the number of keywords in the top 10 for each domain.
The table shows the data from the last check.
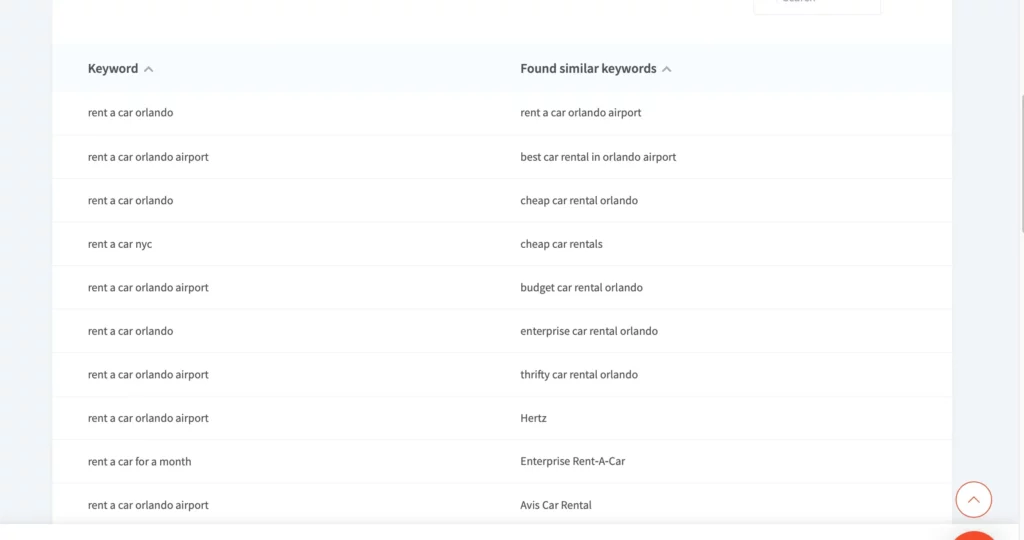
Related keywords tab
The report contains related keywords by keywords loaded into the task.
Keyword – this column displays all the keywords added when creating the task.
Found similar keywords – this column shows collected keywords by keywords.
The collected keywords can be used to extend the semantic core.
Guide to using task editing
When editing tasks, you can change:
the name of the task
the depth of data collection (TOP)
the frequency of data collection
Task settings:
Here, you can add and delete regions.
Keywords:
Here, you can add or remove keywords.
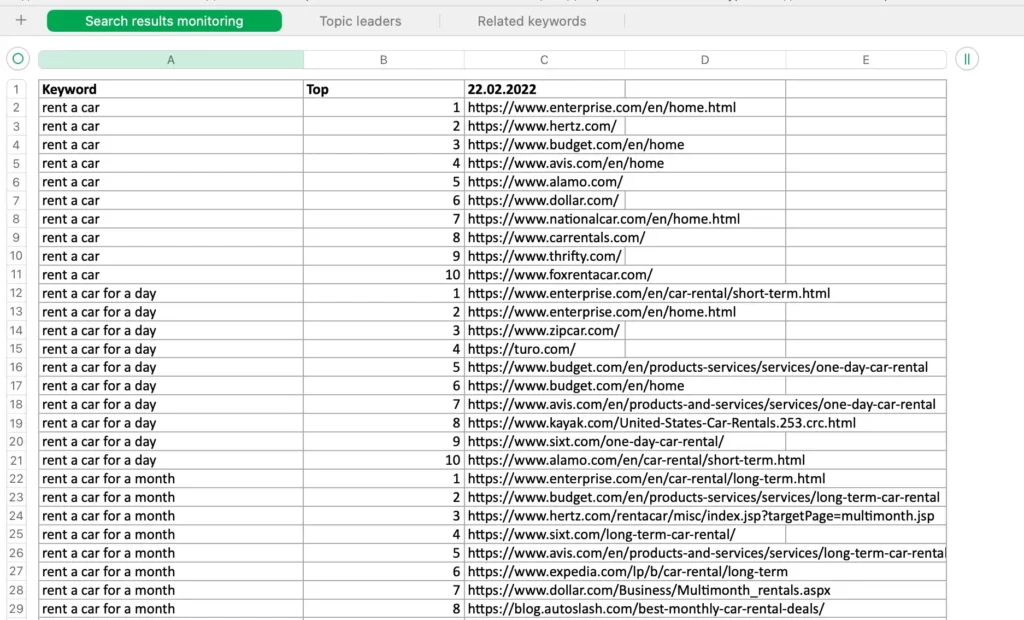
SERP monitor result file
This file shows the results for the period selected in the task.
On the tab with the search results, monitoring keywords and their results are displayed. The Top 10 in the report is marked with colors, so that you can quickly compare the results for the leading sites.
There will also be a report on Topic Leaders and Related Keywords in the file.
Is this article helpful?
 286
286
 0
0

