Google Looker Studio (GLS) is a free online tool that allows you to visualize data, create various reports and dashboards.
The Rush Analytics Rank Tracker Connector is a GLS connector that allows you to visualize the organic ranking data of any site from your Rush Analytics tasks. More information about GLS connectors can be found here
How to activate the Rush Analytics Rank Tracker connector
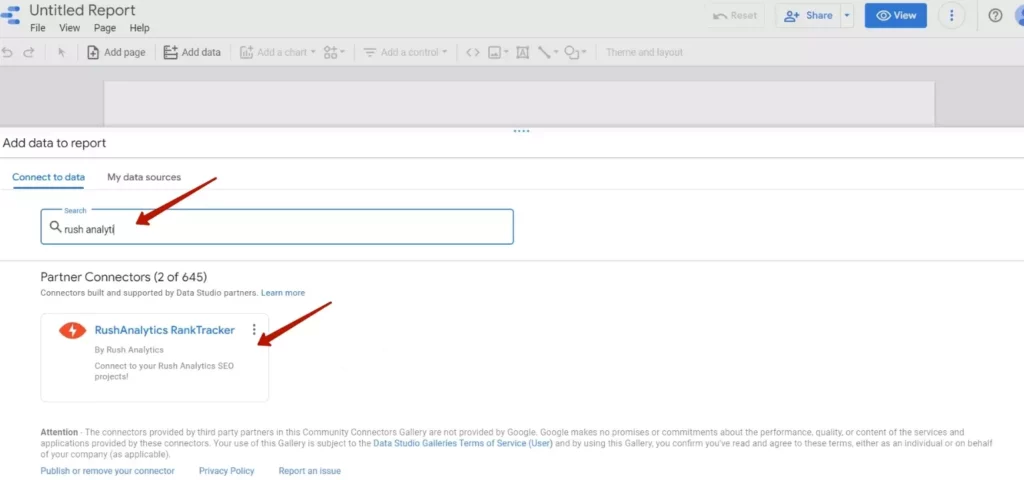
- The Rush Analytics Rank Tracker connector can be found by searching among other Google Looker Studio connectors.
Сlick the “Connect to data” button:
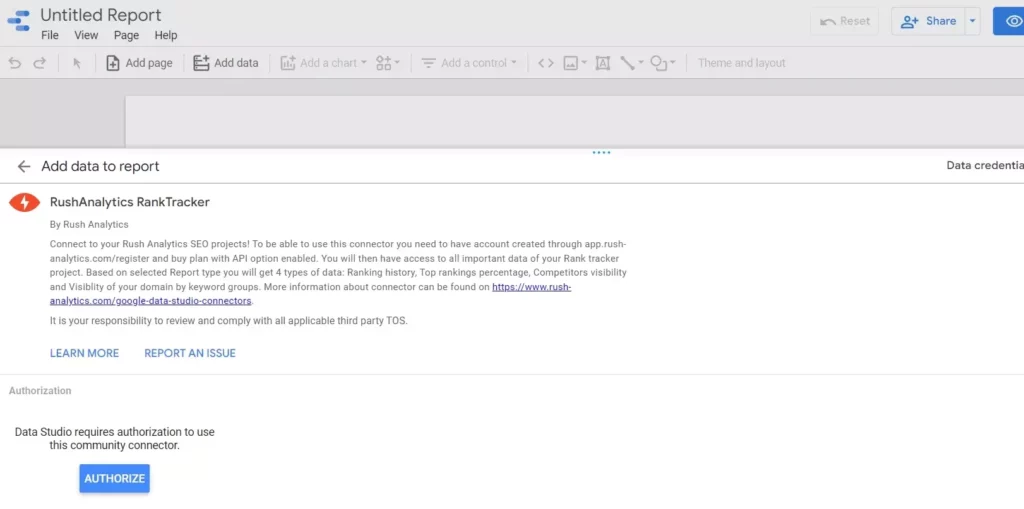
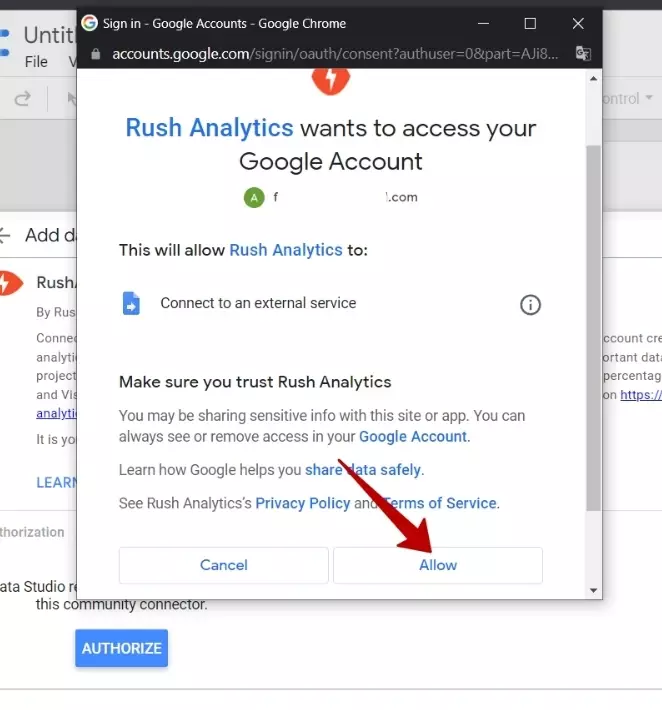
2. Then you need to authorize your Google and Rush Analytics accounts. Click the ‘Authorize’ button to enable the connection and ‘Allow’ Rush Analytics to access your Google account:
3. Set up the data source by selecting the necessary options for your task. All available options can be found in the section below.
How to set up a connector
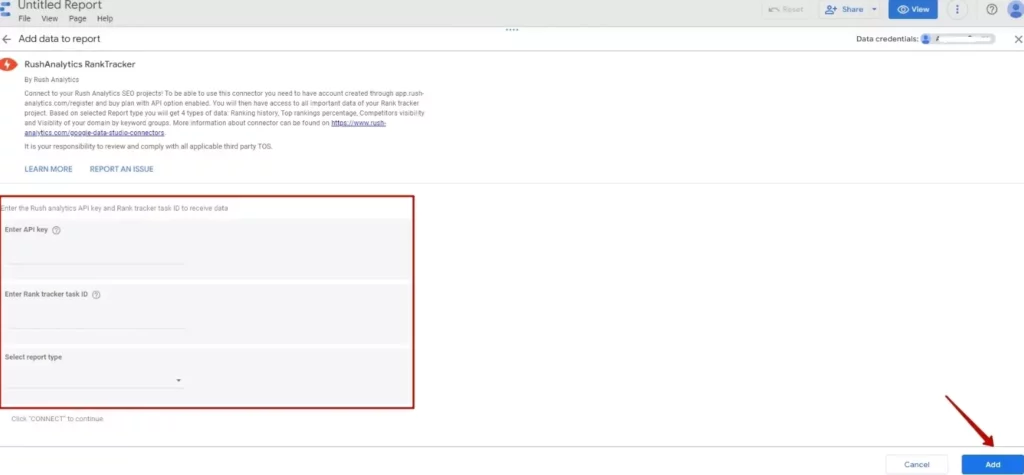
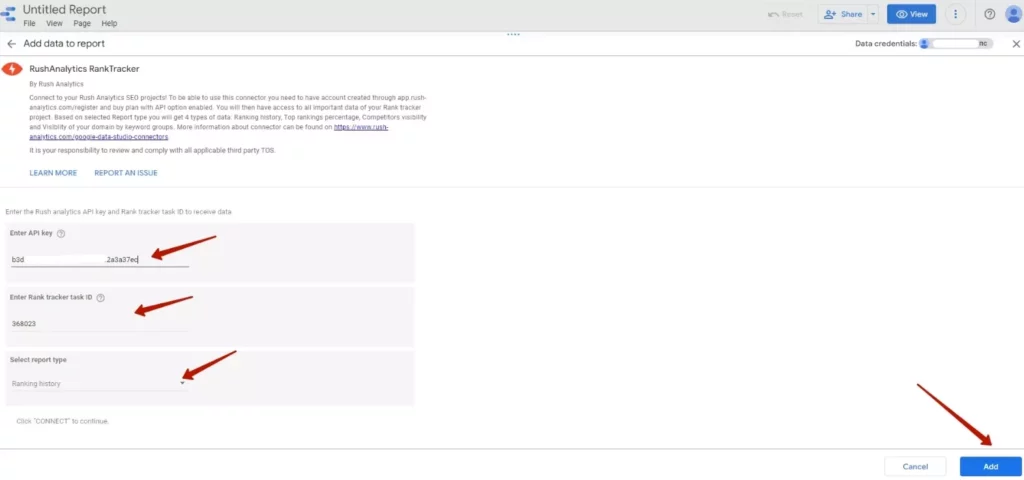
Fill in the connector fields to add an API key, report type and task ID.
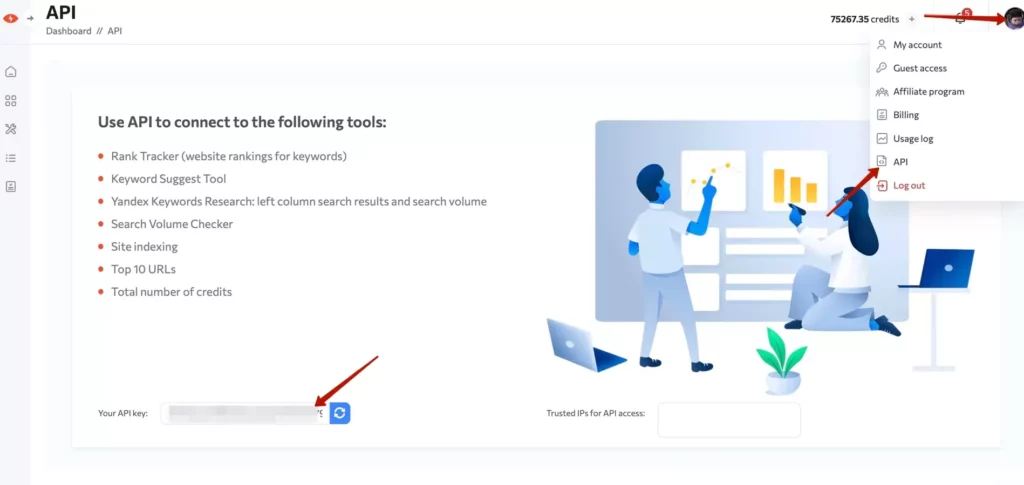
1. API key
You can get the API key in your Rush Analytics account – in the upper right corner, if your tariff plan is PRO or higher:
2. The task
The next step is to select the task ID from the drop-down menu for which you want to get a report. The task ID can be obtained from the address bar of the browser. Just open the desired task in Rush Analytics and copy the numbers at the end of the line. Example:
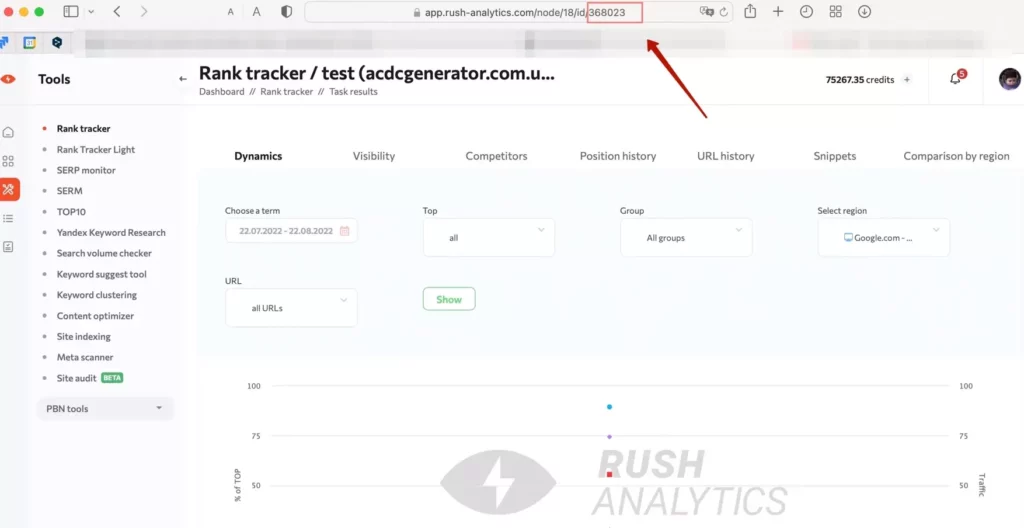
Please note that each region has its own ID. To get the ID of each region that you want to add to the report, you need to open this region in the task and copy the ID.
3. Type of a report
Select the data group for which you want to receive reports. You can choose one of the following options:
- Ranking history – history of all positions collection dates
- Position dynamics (Tops overview) – this report includes data on the TOP
- Competitors visibility – these reports include competitors’ domains, visibility for the selected period and graph.
- Site visibility (Visibility) – these reports include (same data as in the API): traffic, group name, visibility for the selected update period and graph.
If it is not possible to display a table with data and a chart in 1 report, you need to make a separate type of report for position dynamics, site visibility and competitor visibility.
4. After filling in all fields, click “Add” in the lower right corner.
An example of creating a report using GLS tools and data from Rush Analytics can be viewed in the video instruction:
Is this article helpful?
 70
70
 -20
-20