Regularly checking the positions of your site allows you to see what positions the site takes in search engines for the keywords you need.
You can also track changes in search positions over time. Use Rank Checker Tool for this purpose.
* Keyword positions are the rankings of your website in search results
Features of the Rank Tracker
Determining the position of the site in search engines: Yandex all regions, Google all regions and all languages.
- Check the positions of the site for mobile devices and desktop devices
- Free competitor position checking
- Unlimited number of regions per task
- Up to 100,000 keywords per task
- Snippet monitoring
- Customizable frequency of monitoring
- Full editing of tasks in the web interface
- Ability to add groups of keywords
- Convenient filters to sort data
- Regular search volume collection
- Detailed report on your keywords in an Excel file
- Data processing speed
Step-by-step guide to working with the service
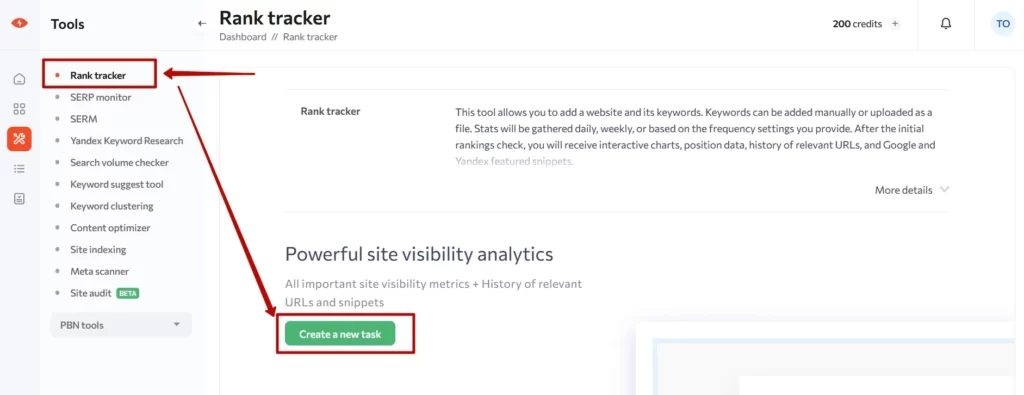
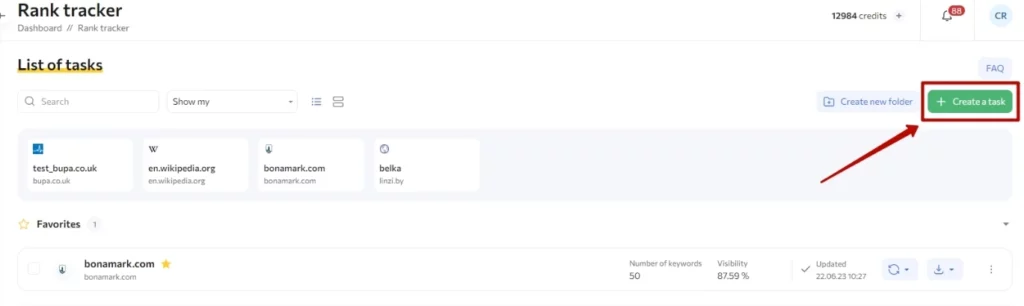
1. Create a task.
Go to the Rank Tracker tab and click “Create New Task”.
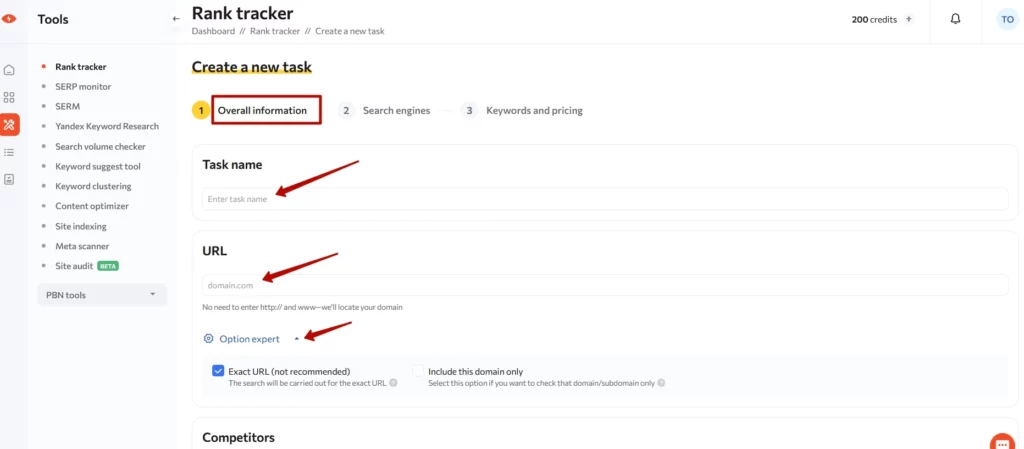
2. Step one. General Information.
Here you should enter the name of the task (mandatory field). You can enter any name: it is often convenient to enter the name of the site, so that in the future it will be easy to find the desired task.
Next, specify the URL of the site for which you want to collect positions – positions will be taken for the entire site. If you need to collect positions for one specific URL (for example, for a group in social networks, or your YouTube channel), choose the expert option “Exact URL”.
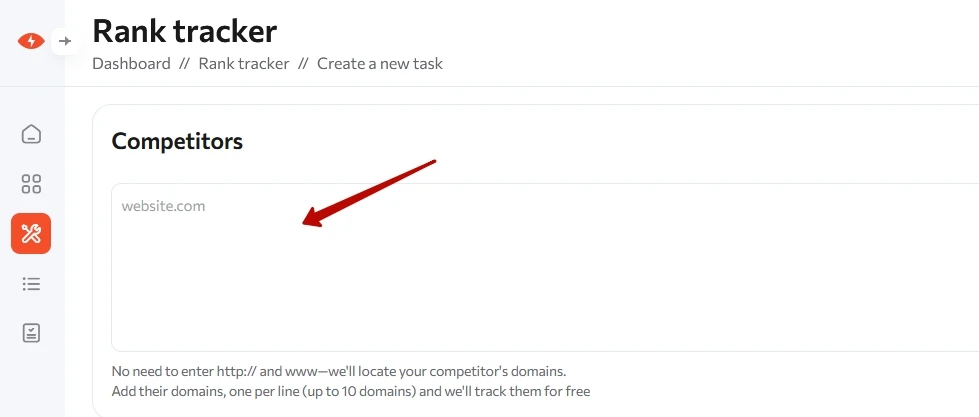
Competitors
You can add up to 10 (maximum) selected competitors to this field, each from a new line. They will be marked with asterisks in the ready task interface.
Frequency of collecting
There are several options for the frequency of position collection:
- Daily – Positions will be collected every day
- Weekly – Positions will be collected once a week – the weekday of the task launch coincides with the day of creation
- Manually – Positions will be collected when you start collecting them manually.
- By Yandex updates – Positions are collected on updates of Yandex output
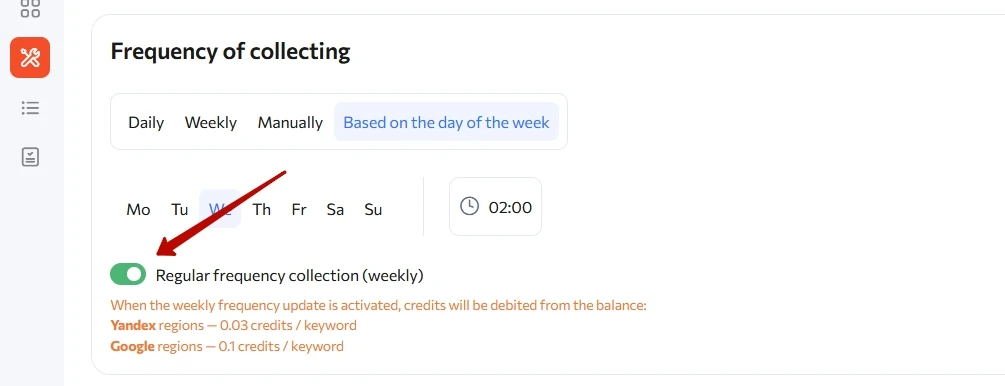
Based on the day of the week – Positions will be collected at given days and times.
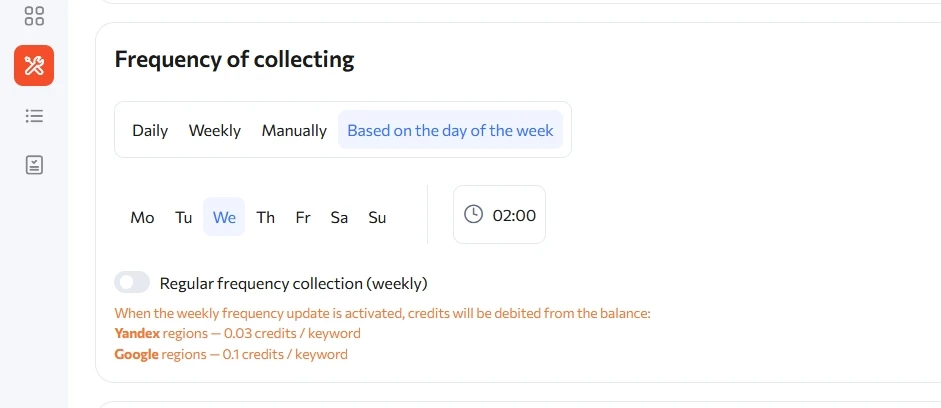
Regular frequency collection (weekly) – Slider for weekly automatic frequency updates. We recommend turning it on if you want to track the seasonality of keywords
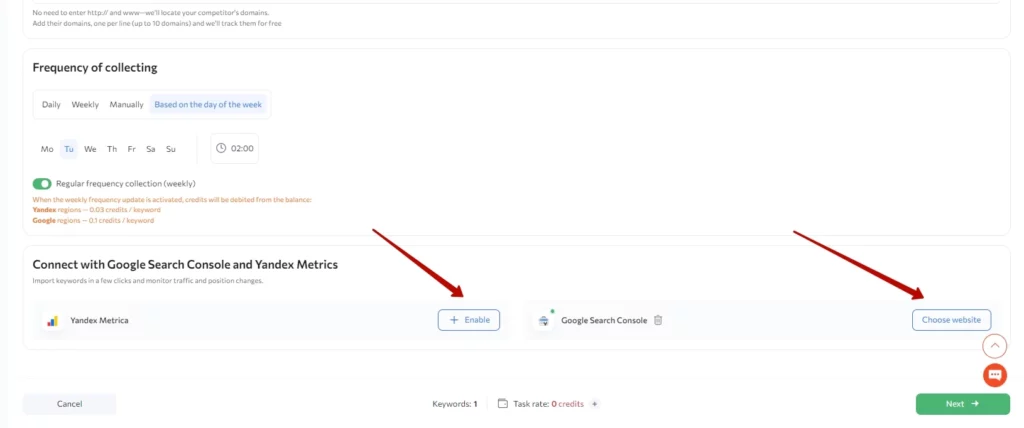
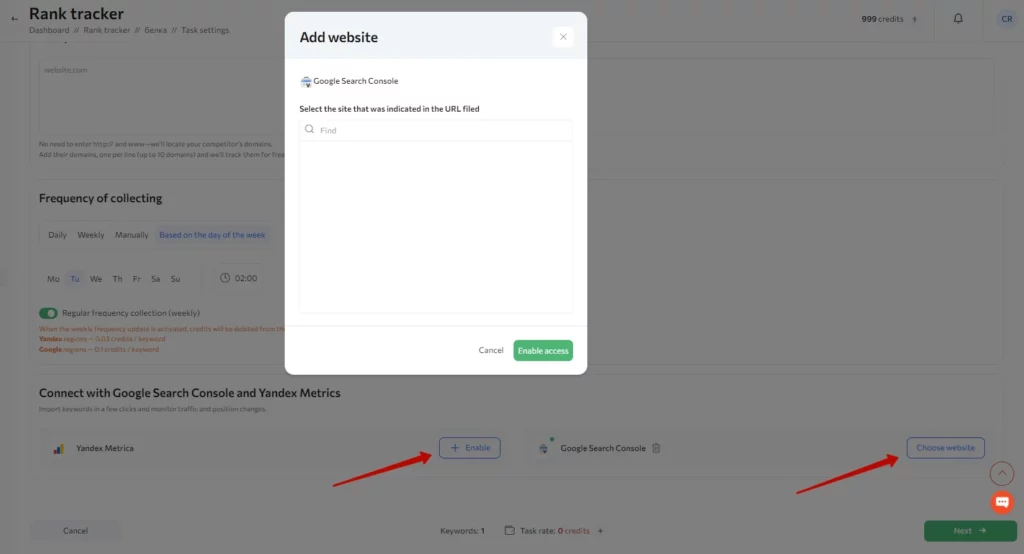
Also at this step you can connect access to Yandex Metric and Google Search Console analytics. Just click on the “Enable” button and then authorize in your Yandex or Google account.
You will see “Choose website” after the access connection procedure is complete. Be sure to click on it and select the site from which you want to import information. Then you can move on to the next step.
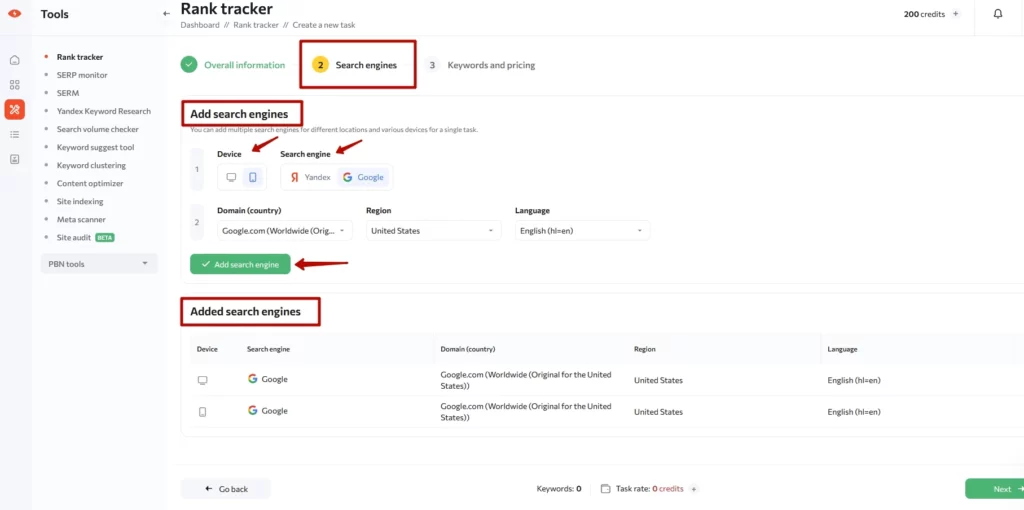
3. Step two. Search engines.
Here you need to select the device for which you will check the positions, and the search engine on whose data the positions will be collected. You can choose to collect the positions for Yandex and / or Google. For Yandex, all regions are available. For Google, all regions and languages are available.
You can add an unlimited number of regions to the task.
4. Step three. “Keywords and price”.
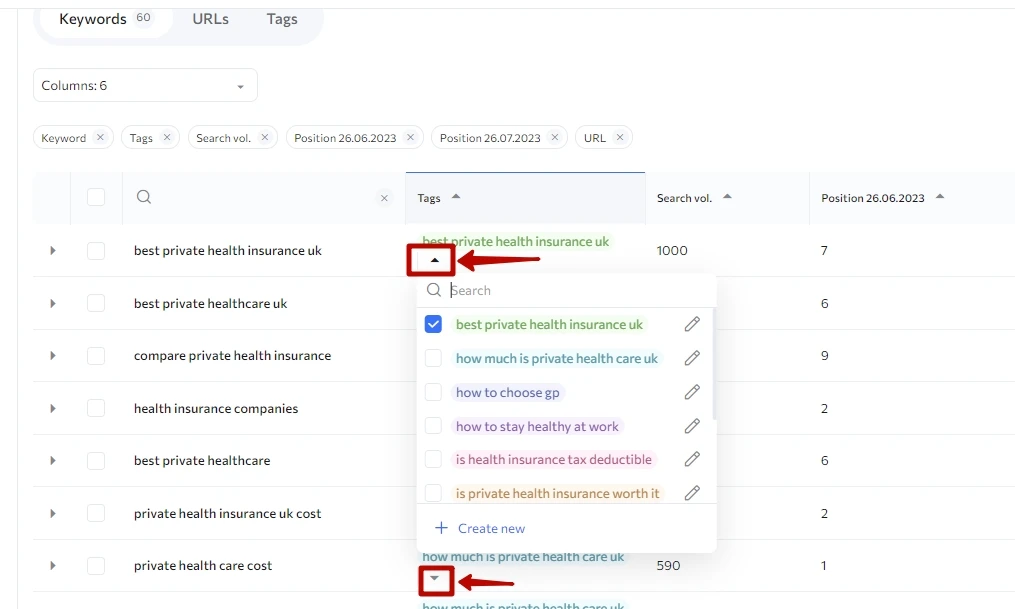
It is possible to load keywords in the field or via a file. Also, you can create tags, which can then be defined to the desired keyword when adding keywords through the field.
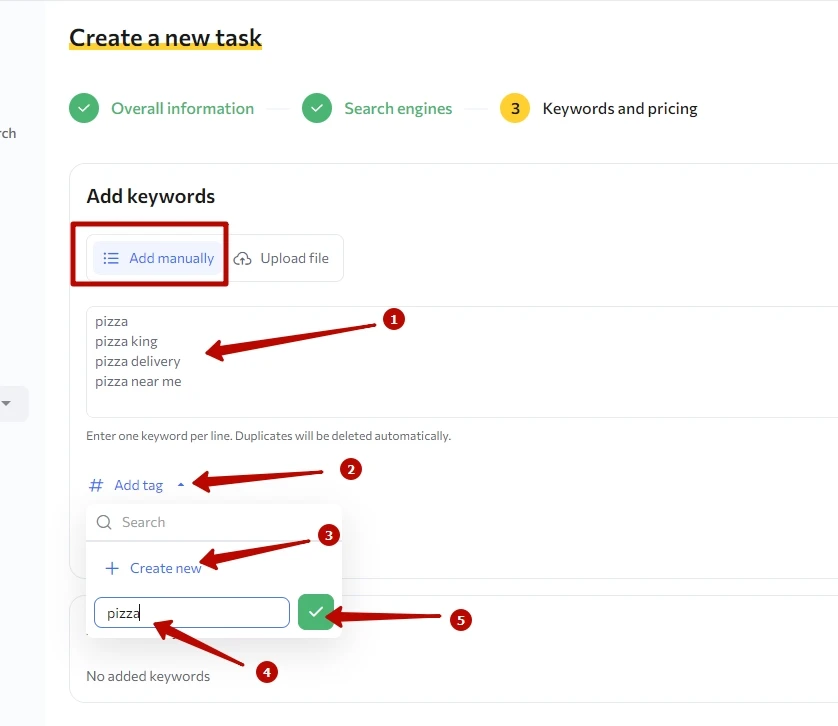
You can create as many tags as you want this way.
You can combine as many keywords as you want under one tag.
But you can add only 10 tags maximum to one keyword.
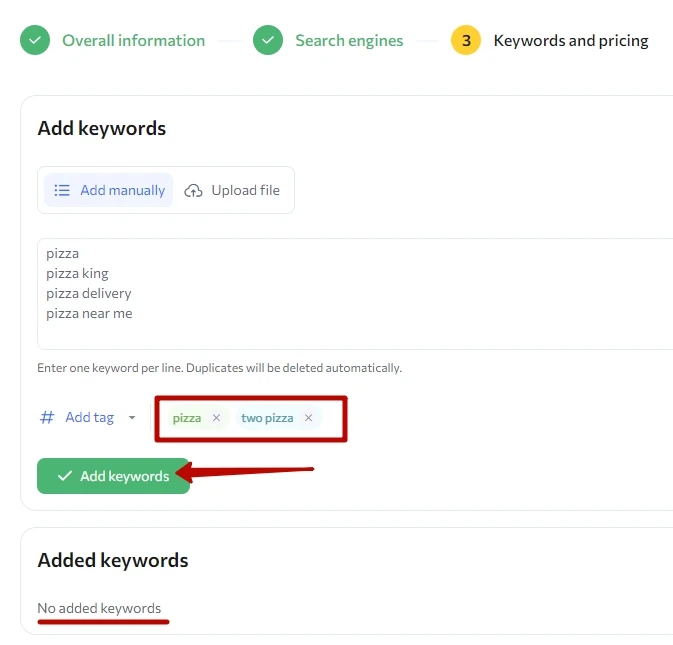
Be sure to click the “Add keywords” button after entering keywords in the field.
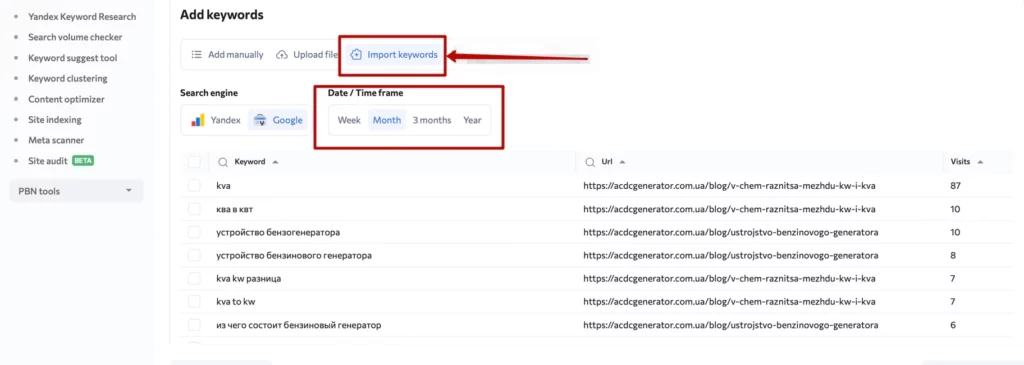
Users who have connected access to Yandex Metrics or Google Search Console during the first step of creating a task will see the Import Keywords tab in this window. It can be used to import keywords directly along with traffic from Yandex and Google for a selected period:
Features of downloading a file with keywords:
You can upload keywords and tags, and set the target URLs via a file.
The format of the file in this case will be: KEYWORD | URL | TAG
It is important to note the file format before uploading:
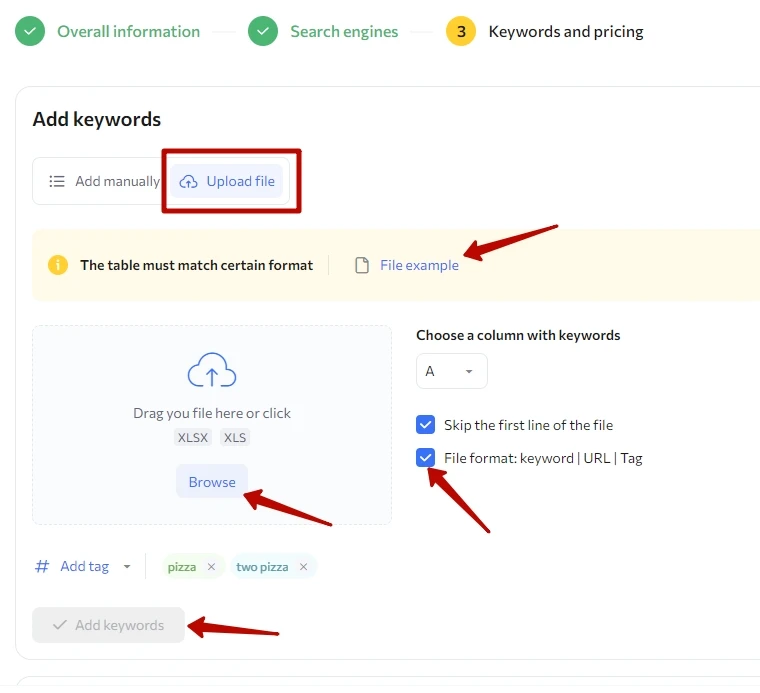
If you load only keywords, then uncheck it or select a column in the file to be loaded (if needed).
The system always focuses on the first column as keywords.
If there is no data for tags or URLs, leave the corresponding column blank.
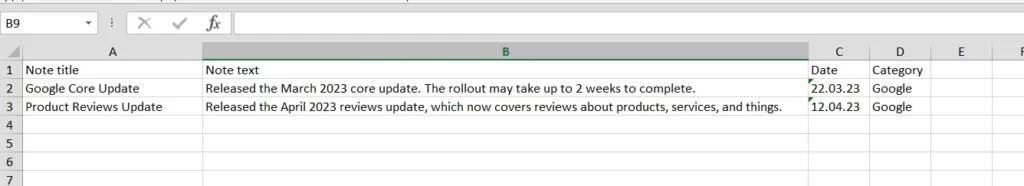
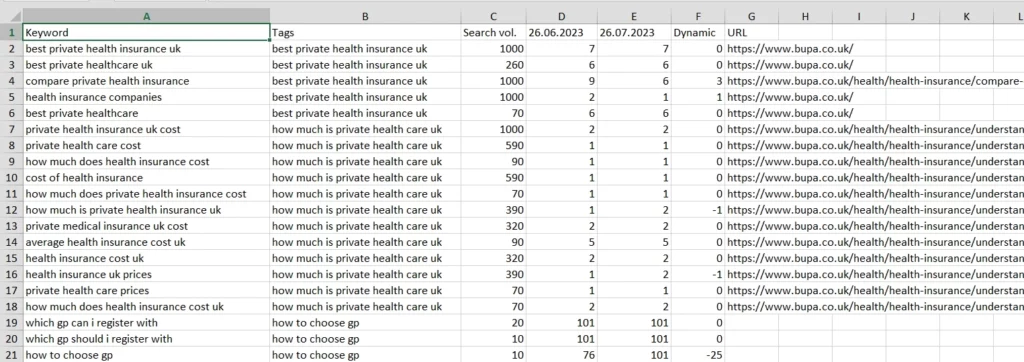
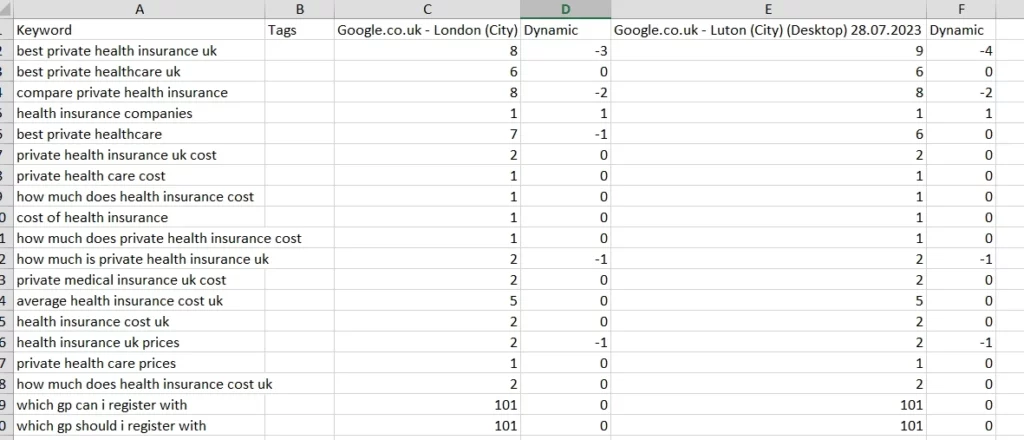
You can download a sample file here: FILE EXAMPLE
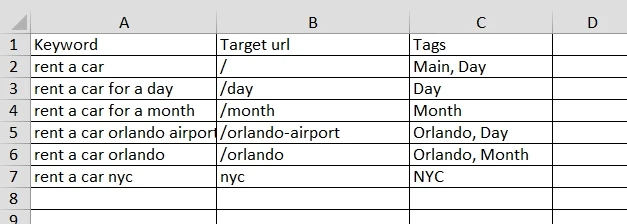
In column “A” you specify keywords
In column “B” you specify target URLs
In column “C” you specify the names of the tags
Files can be downloaded in several formats: XLSX, XLS, CSV
If a keyword falls under different tags, then write the names of the tags, separated by comma and space in the file, as in the example.
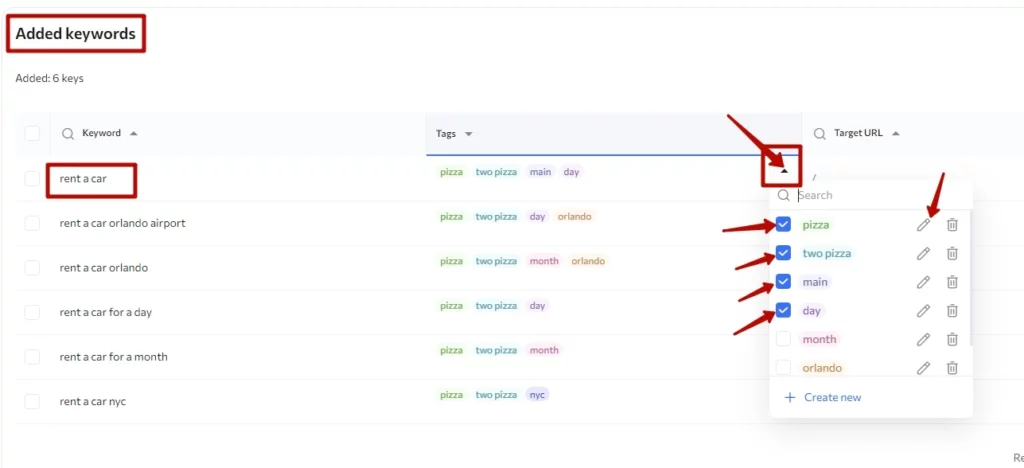
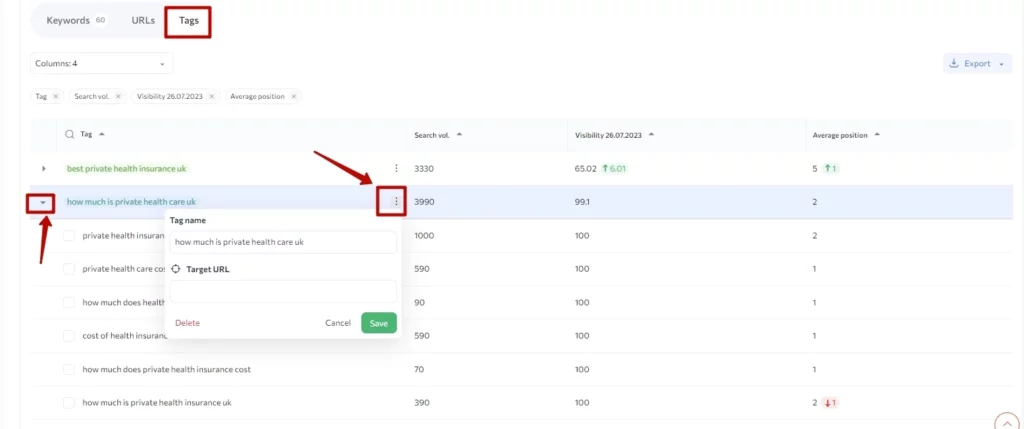
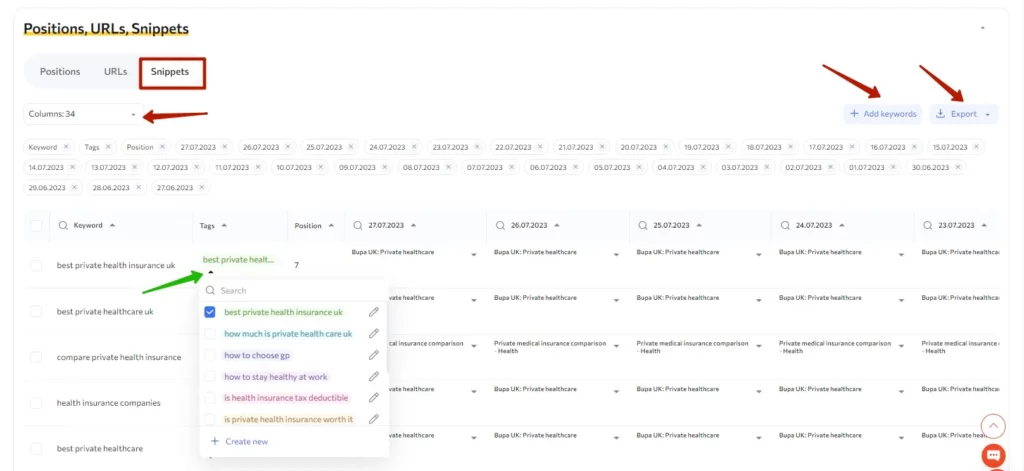
Tags are also editable, in the interface and via file.
You can do this on the last step in the added keywords field in the task view:
- Select up to 10 tags for the keyword.
- Edit the tag name.
- Create a new tag for a keyword.
- Search by keyword, tag and URL is also available.
How to split keywords into tags. Why do I need to tag keywords?
This allows you to see more clearly what happens to your positions on separate pages, directory sections, page types (card or directory), keyword types, etc. You can also monitor the visibility of all keywords by tags leading to a section or page, analyze changes in positions by tags after updates, and quickly and more accurately respond to changes in ranking.
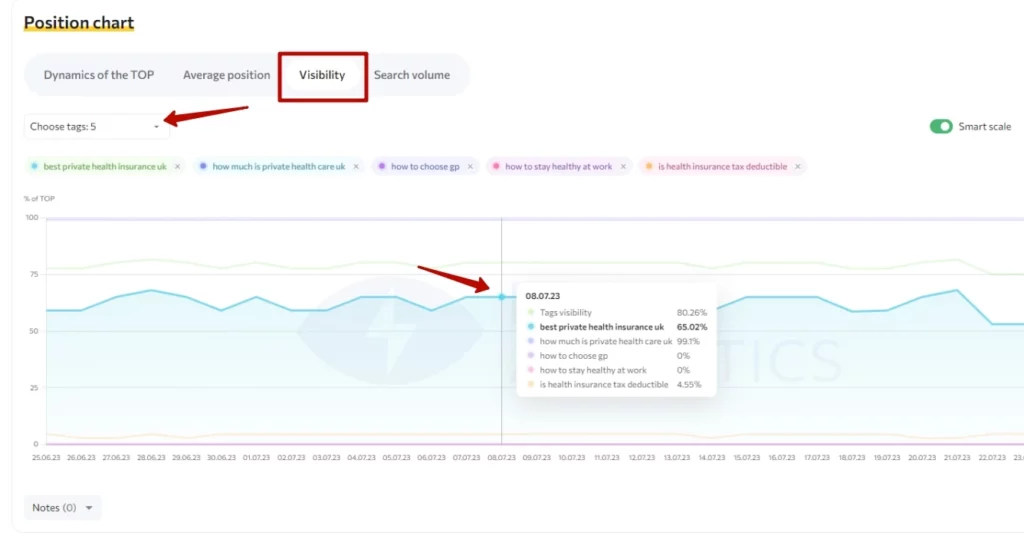
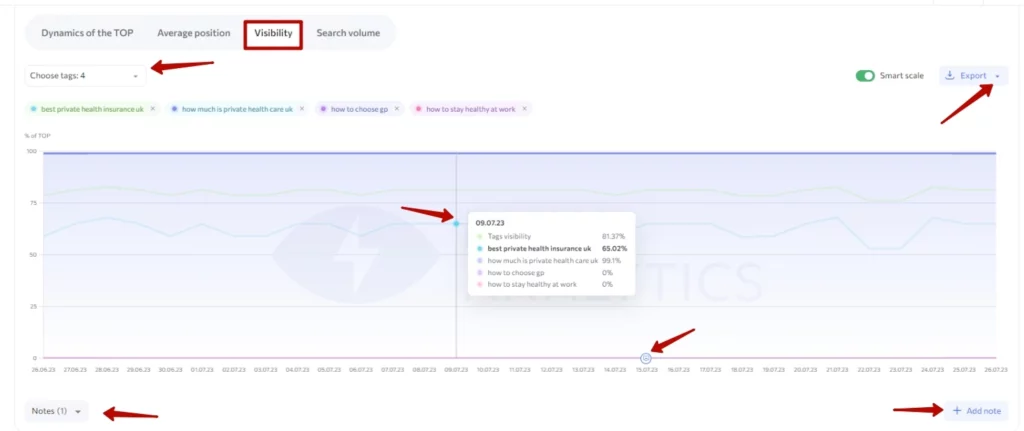
An example of a visibility graph for tagged keywords:
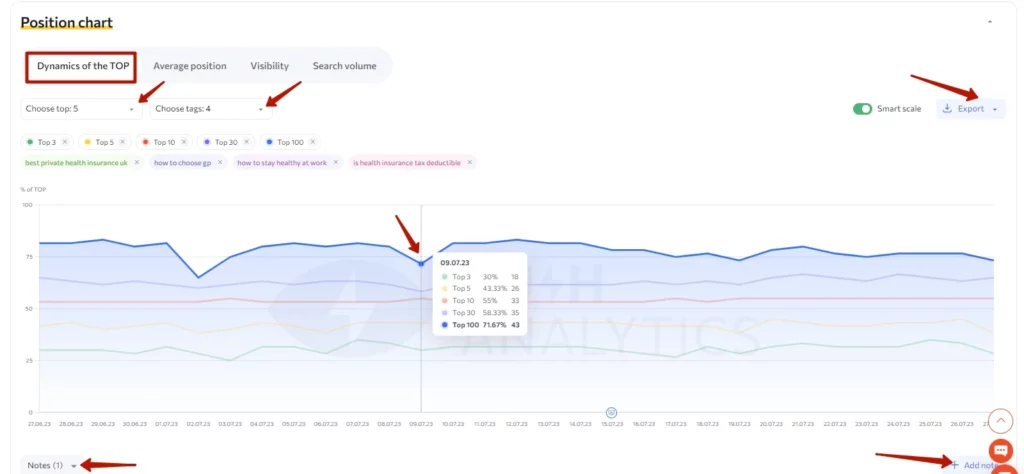
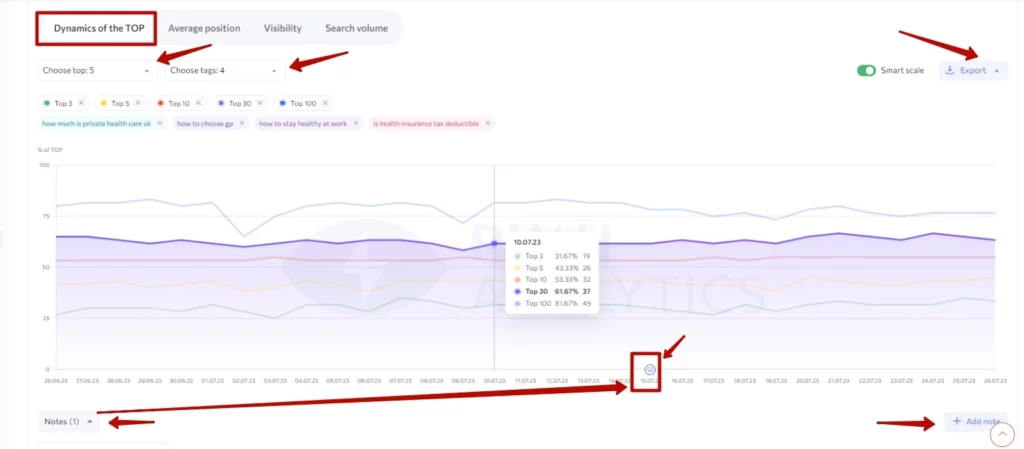
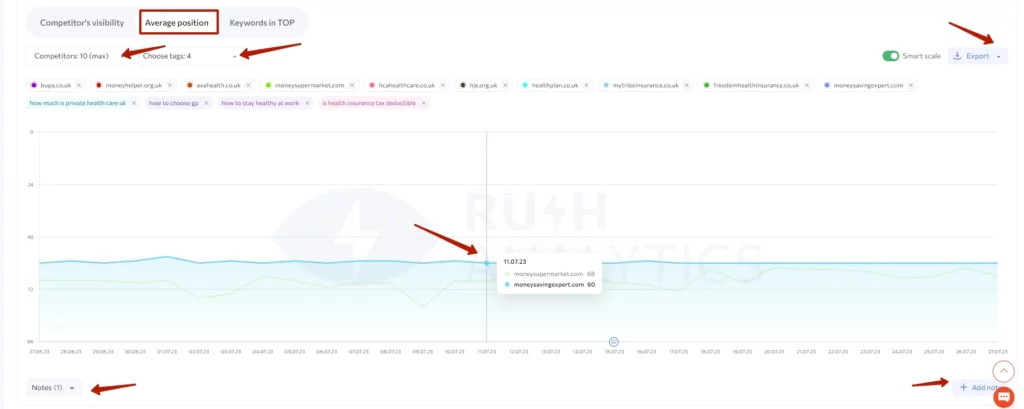
An example of a dynamics positions graph for tagged keywords:
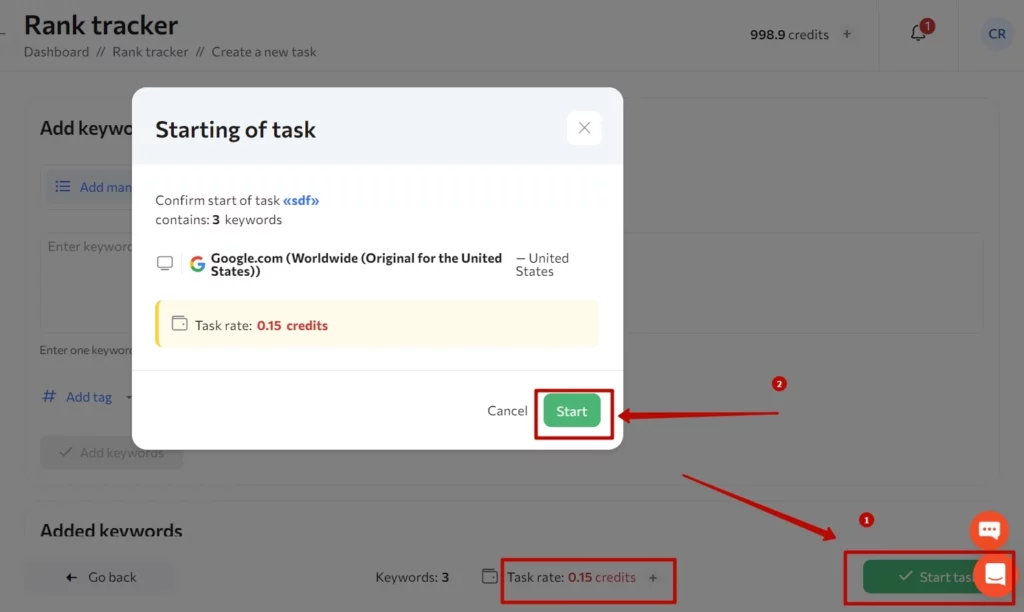
5. The system will calculate the cost of the task after adding a list of keywords or a file. Click on the button “Start task” and then the “Run” button in the pop-up window.
Rush Analytics has several statuses in the Rank tracker:
- In queue – Data collection is about to start
- Parsing – Data collection task is in progress (wait for completion)
- Updated (date) – Task is ready. You can see the results in the web interface or download files in .XLSX or .CSV format.
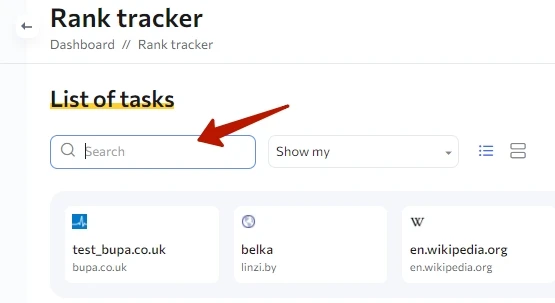
Task listing and its capabilities
1. Search by domain or task name.
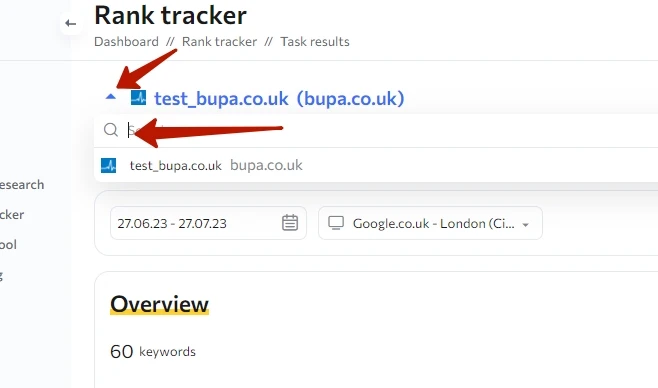
There is also a search field in the view of any task, on any tab, in case you need to go directly to a particular tab of a particular task.
2. Advanced task options – You can display a list of tasks by owner: show general – display all tasks from the client and guest accounts.
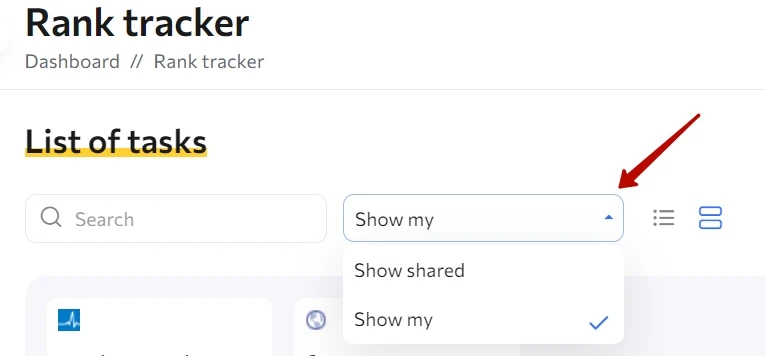
*available to customers with a subscription with guest access.
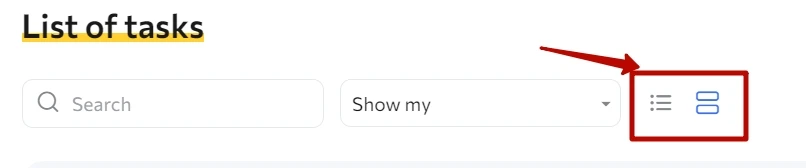
3. Task list mode – Switches the window view from a minimal view to a multifunctional set of options.
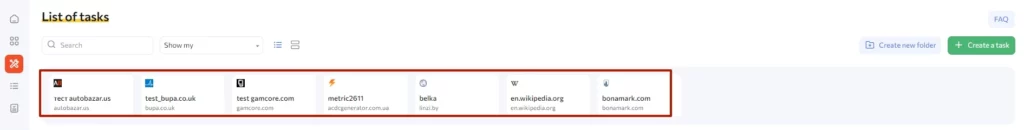
4. List of the last viewed tasks – A block that displays the 10 last opened tasks, from the newest to the oldest.
If you delete a task from the listing, it is no longer displayed in this block.
The maximum number of cards displayed is 10.
The data is displayed for the region that was first added to the task.
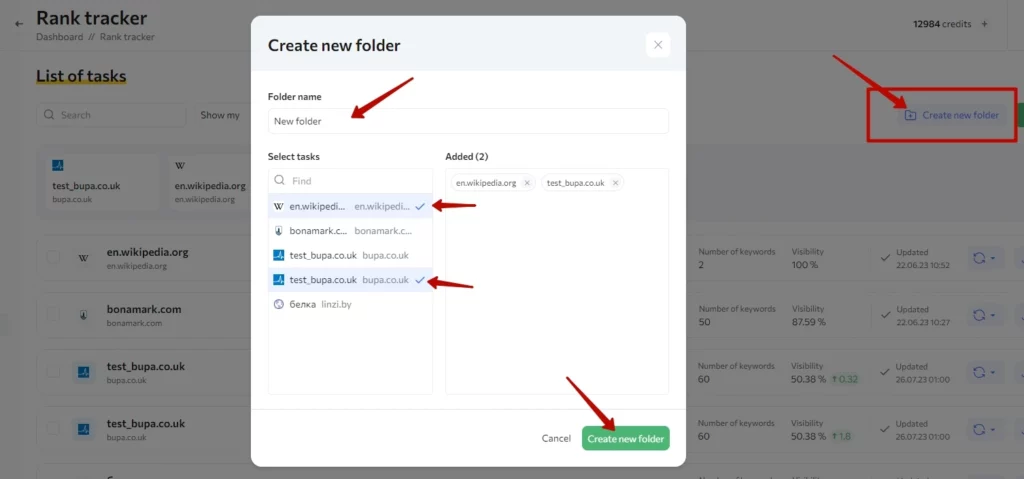
5. Create folder – You can create a new folder and move selected tasks to it. There should be at least one task on the listing for this to happen.
If you do not define a task in a folder while creating it, it is automatically sent to the General folder.
Open folders remain as you left them the next time you sign in to your account. If you close folders, it works the same.
6. It is possible to edit a folder by clicking on the triple dots and selecting “Edit” in the modal window:
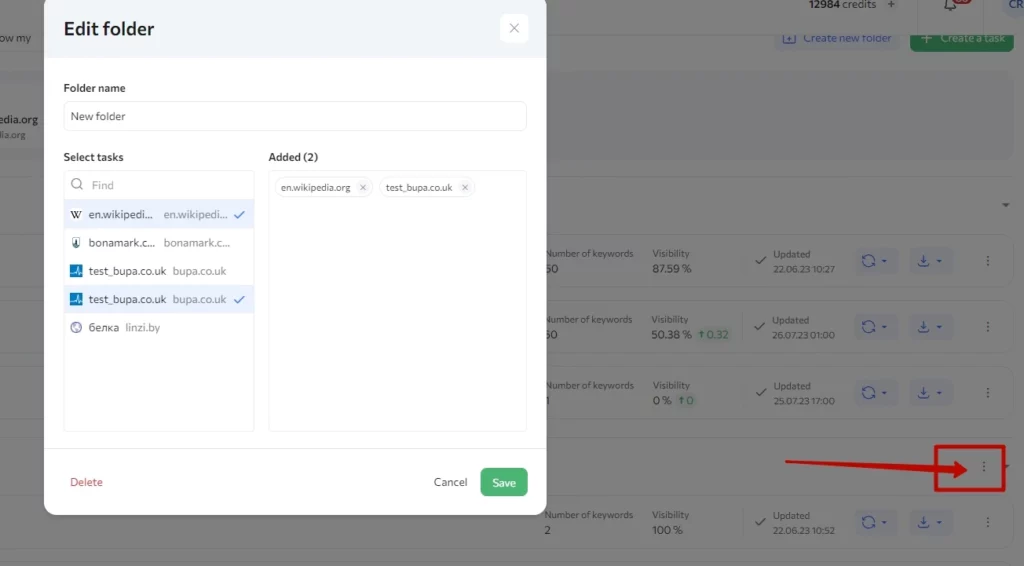
You can delete a folder without deleting tasks using this option. Just move them to another folder in the pop-up window. Empty folders will be deleted automatically.
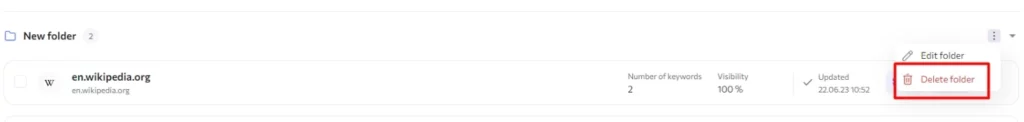
Also you can simply Delete the folder with the tasks by clicking on the triple dots next to the folder name. Then click Delete and select the desired folder in the pop-up window:
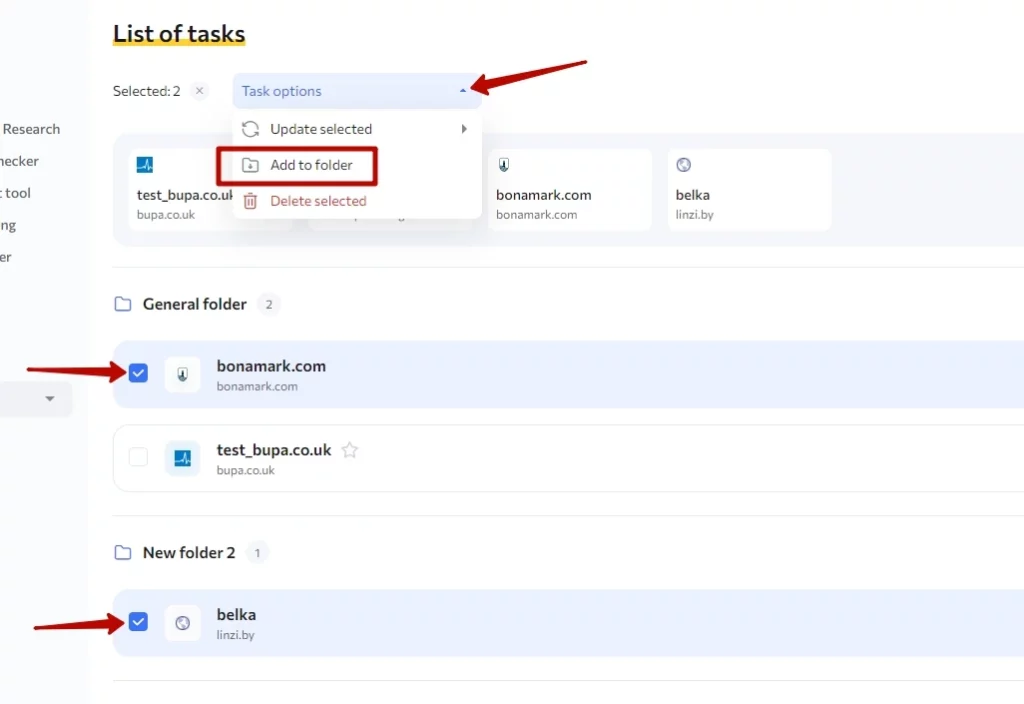
7. Transferring several tasks to a selected folder at once or deleting tasks en masse:
Check the checkboxes of the required tasks in the open folders on the listing. A button with additional “Operations on Tasks” options will appear
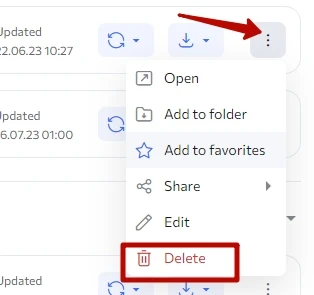
*You can use the modal window with options for editing to quickly delete a task:
8. Selected tasks
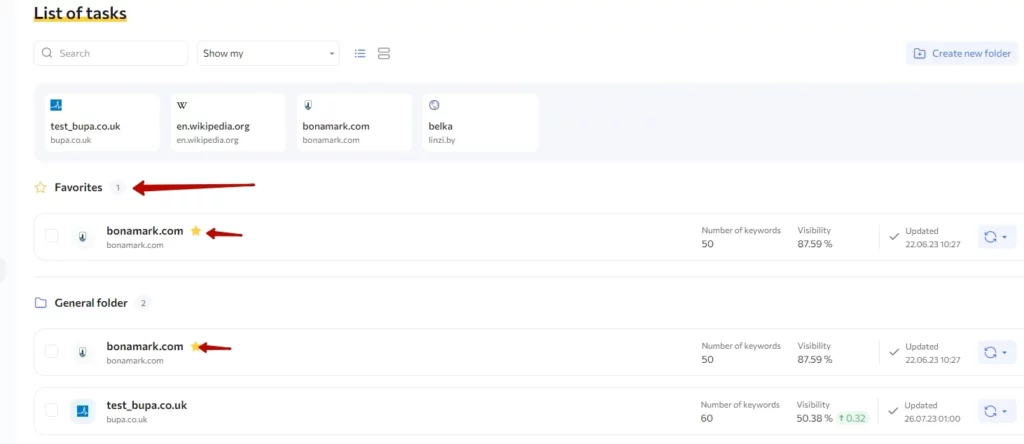
This option allows you to mark with an asterisk the priority tasks that you work with most often, and which will be the first on the list in the Favorites folder. These tasks will also be divided into the folders in which they were originally added, but marked with an asterisk. As a result, the listing shows the Favorites first, then the General Folder and the rest, so the most important tasks are always at hand.
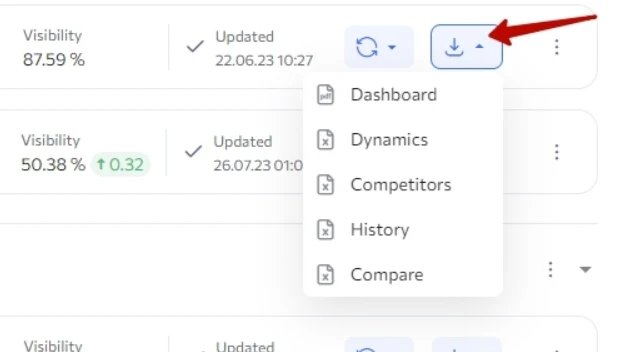
9. Download data: Report files available in .XLSX and .CSV formats (both from the view) :
10. Create a task – Switch to creating a task step by step.
11. Update positions – Update positions for the selected regions.
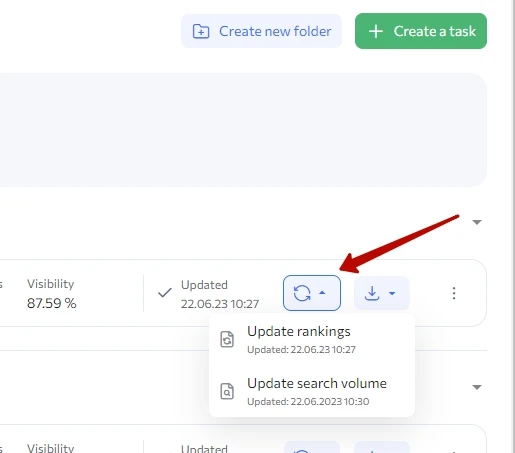
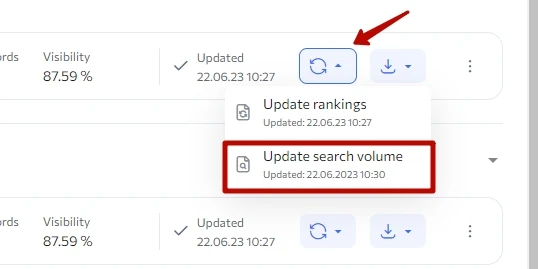
12. Update search volume – Update the search volume for the selected regions.
It works like this: visibility is determined for the current date of the rankings update and all subsequent dates until the new search volume update.
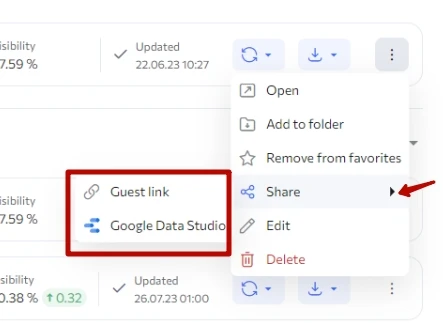
12. Guest link
13. Connecting Google Data Studio
Rush Analytics API integration guide with Google Data Studio
14. Large task preview card – Available in full screen mode on the listing:
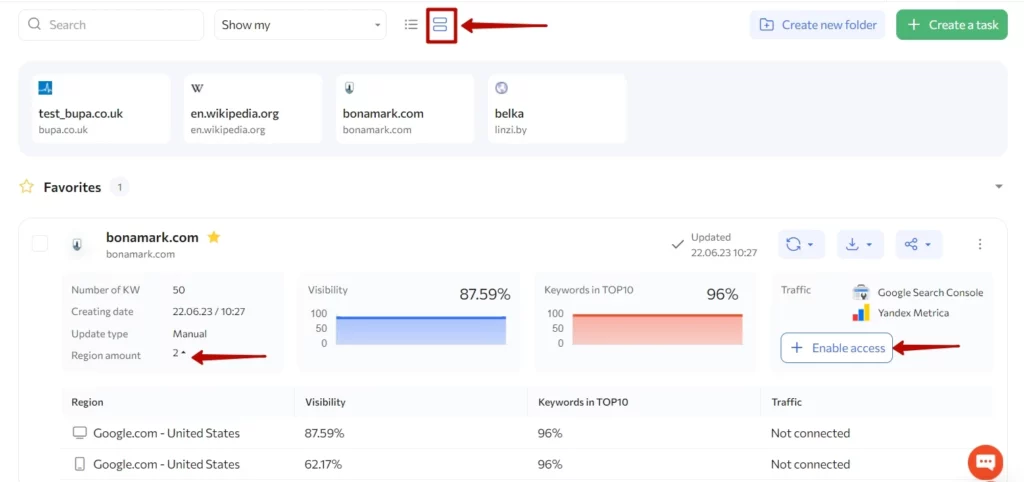
It contains the following information about the task:
- Number of keywords, Creation date, Data collection frequency, Number of regions, favicon, task name, domain
- Visibility graph for the region in percentage that was added to the task first (main region)
- Graph of keywords in the Top 10 – by regions that were added to the task first (main region)
- Whether Yandex Metric or Google Search Console is connected
- Possibility to update positions and search volume
- Share button – Guest link and Google Data Studio link
- Task settings – open, move to folder, delete, edit
The main tabs are available:
- Dashboard
- Dynamics
- Competitors
- History
- Comparison by region
Let’s take a closer look.
Working in the web interface
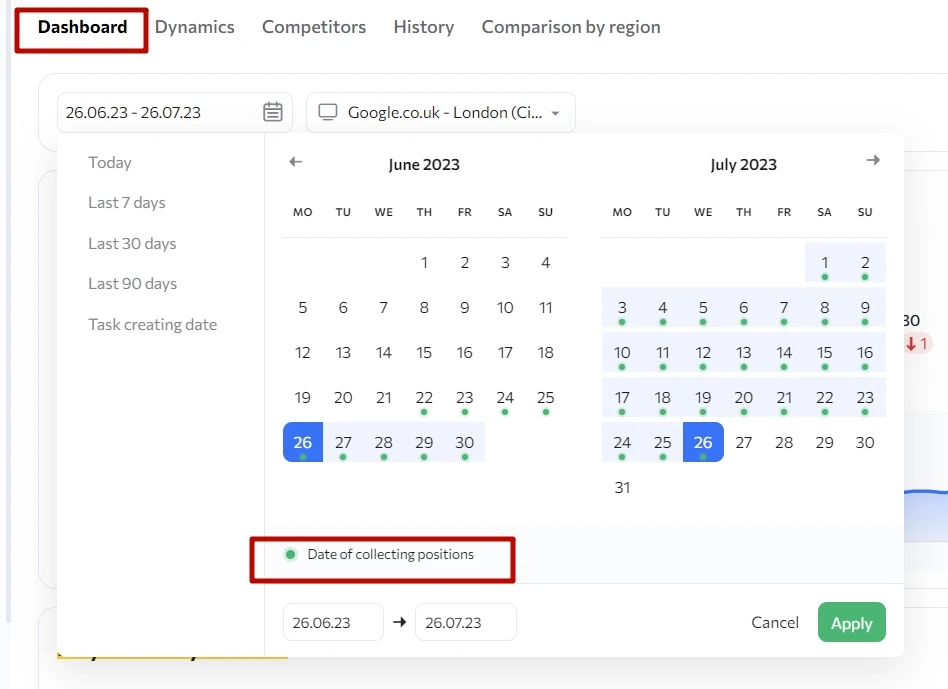
1. The Dashboard tab contains:
- Overview
There is a calendar, which marks the dates of updates:
Possibility to choose or add region:
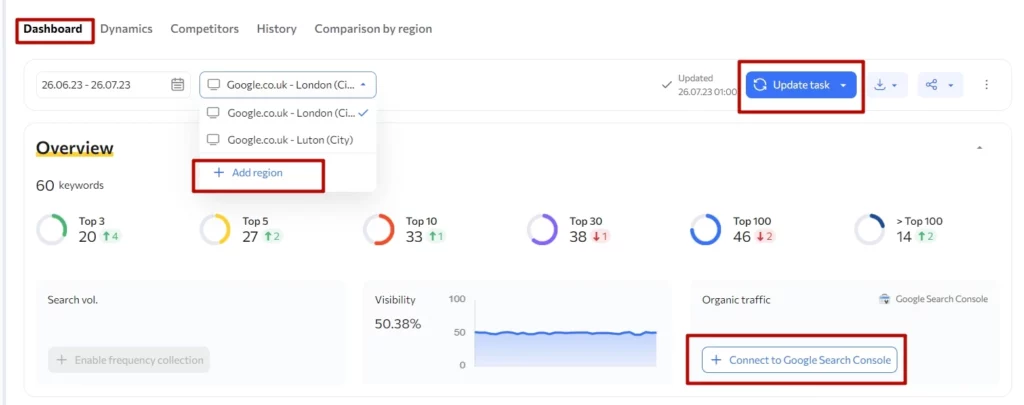
* The task automatically starts collecting when a new region is added and you click “Start”. Only newly added are collected (any Add Region button leads to the task settings)
You can also connect the Google Search Console and see the visibility graph for the specified region and selected period, the number of keywords in the top, and the source of traffic. Plus you can download table reports: Dynamics, Competitors, History, and Comparison regions in .XLSX format.
- Keyword dynamics – Number of keywords in the task in general; drop or growth in keyword positions, as well as the number of unchanged in percentage
- Keyword overview – A list of dropped or grown keywords with positions and search volume
- URL overview – A list of fast growing or fast dropping URLs, Number of KWs, Visibility
- Tags overview – A list of fast growing or fast dropping tags
- Competitors overview – A list of fast growing or fast dropping competitors, Number of KWs, Visibility
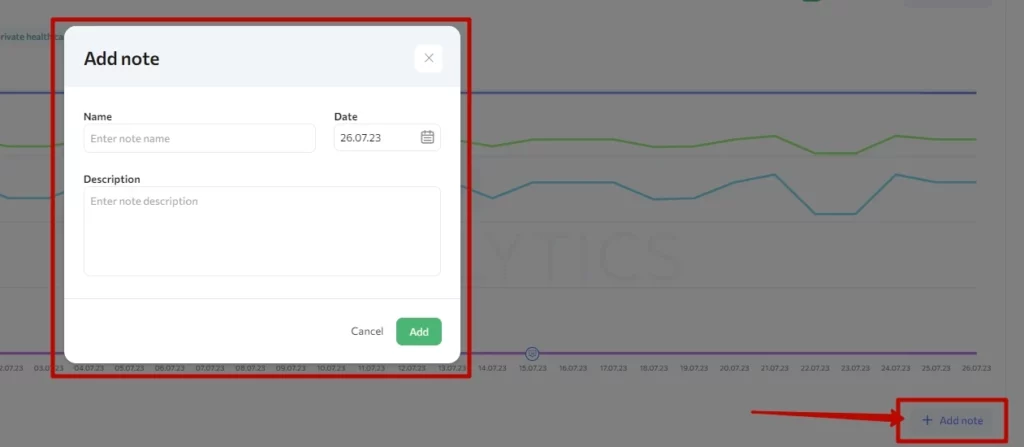
- Notes:
You can add notes and download the report in XLSX or CSV format:
2. The Dynamics tab contains:
- Position chart – You can select the scale of the graphs, customize the data displayed with filters, and download reports in PNG and PDF formats. They include:
- Dynamics of the TOP
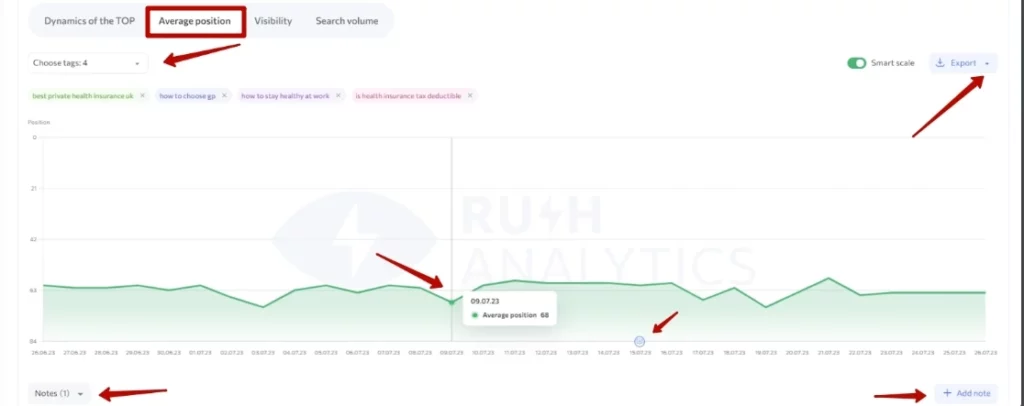
- Average position for chosen tags – The data on the graph is summarized by tags:
- Visibility chart by chosen tags:
- Search volume – Search volume graph for the selected tags (with regular SV updates)
The visibility is calculated using the mega-index formula on the graph
Q1, Q2, … Qn – query visibility 1,2, … n in specified tag
Q1 = 1, if the request position is from 1 to 3.
Q2 = 0.85, if the request position is 4.
Q3 = 0.6, if the request position is 5.
Q4 = 0.5, if the request position is from 6 to 7.
Q5 = 0.3, if the request position is from 8 to 9.
Q6 = 0.2, if the request position is 10.
Q7 = 0.1, if the request position is from 11 to 15.
Q8 = 0.05, if the request position is from 16 to 20.
W1, W2 … Wn – The exact wordstat search volume of these keywords («!»)
VIS – Keyword visibility in % by tags
VIS = 100 * (Q1*W1 + Q2*W2 + … + Qn*Wn) / (W1 + W2 + … + Wn)
The total visibility is displayed on the graph for the selected tags, as well as for all keywords.
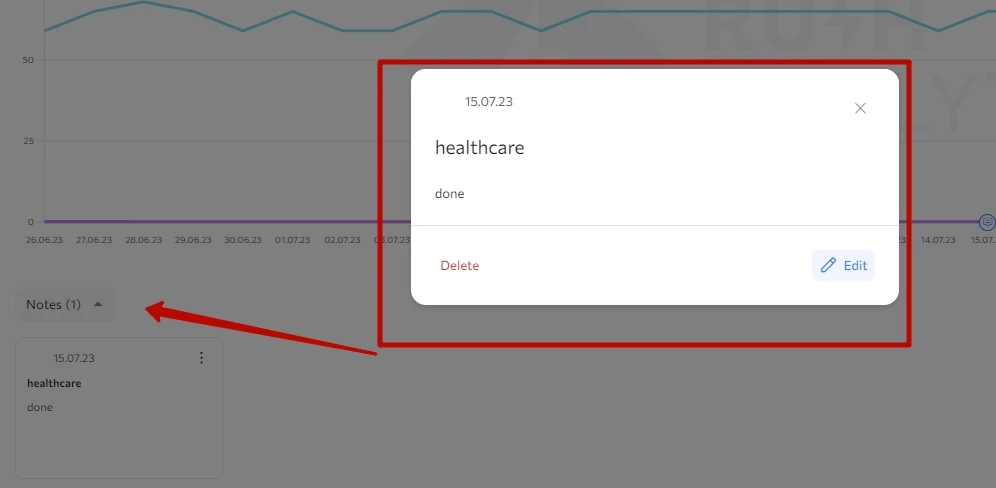
It is also possible to:
- make/view notes on charts:
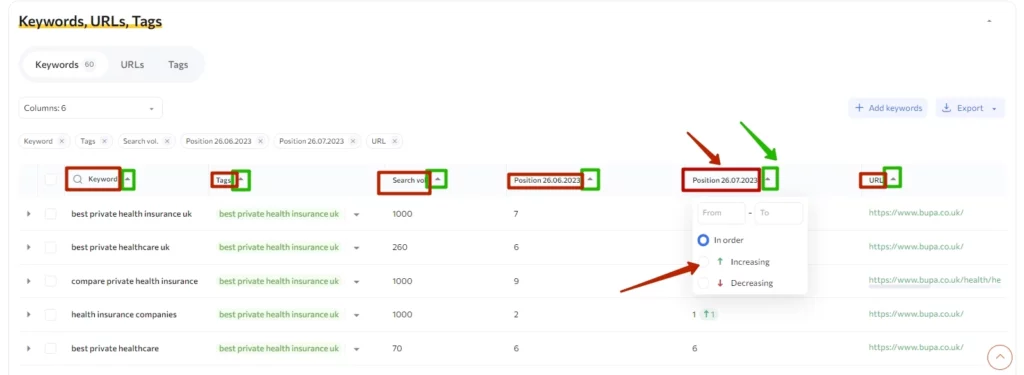
Tables with Keywords, URLs, Tags – You can customize the data displayed by using filters on the columns in the table, as well as:
- Keywords – Here you can see reports in .XLSX or .SCV formats:
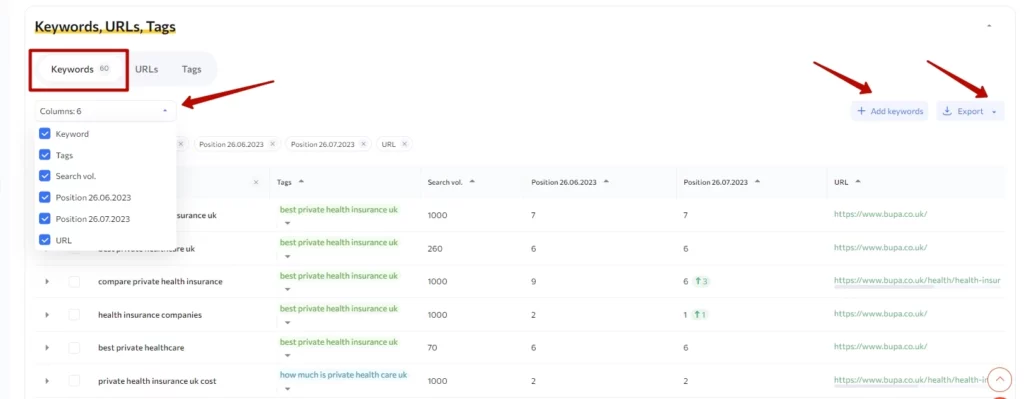
The tab includes filtering by value (tag selection or filtering by value):
- Add new keywords
- Delete keywords
- See a graph of positions and search volume for a specific keyword
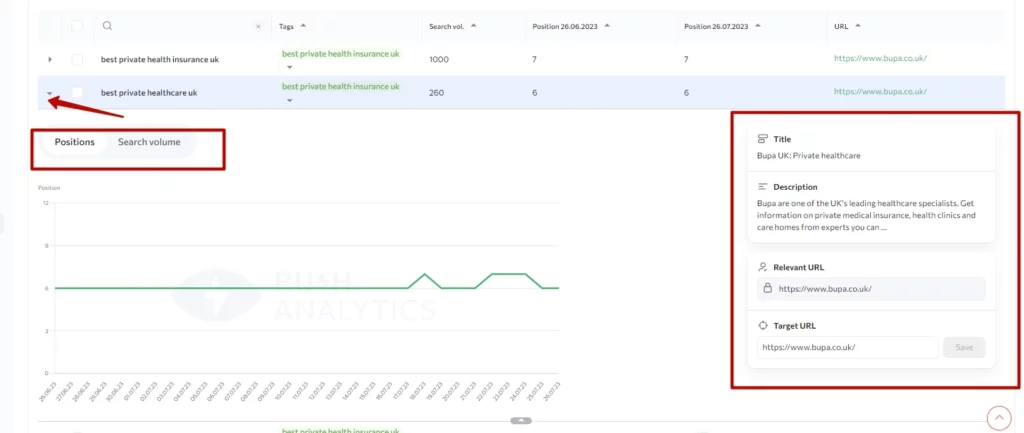
- See Title, Description for a specific keyword
- Add URL
- Edit tags, URLs
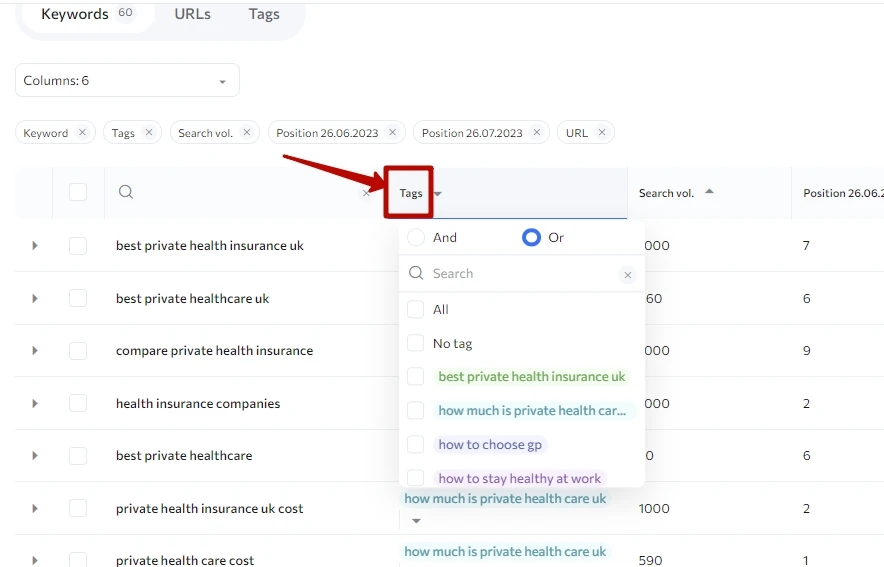
- URLs – Graph by specified URLs, where you can see, delete/add keywords for them, as well as see the visibility and average position for keywords associated with these uploaded URLs:
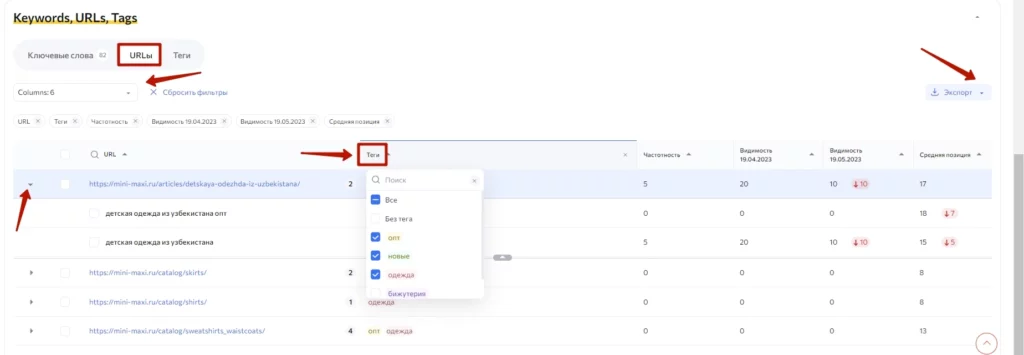
- Tags – Data on visibility, search volume and average position for the specified tags:
The tab includes filtering by value (tag selection or filtering by value):
3. The Competitors tab and related – You can adjust data with filters by column in charts/tables, select the highlighting of the top, download reports in .XLSX or .SCV formats, and add/remove keywords or competitors to track.
The tab includes:
Competitor charts:
- Competitor visibility – You can display up to 9 competitors + your site at the same time (10 active lines together). It is possible to view by tags and scale charts, plus you can download reports in PNG, PDF and add notes:
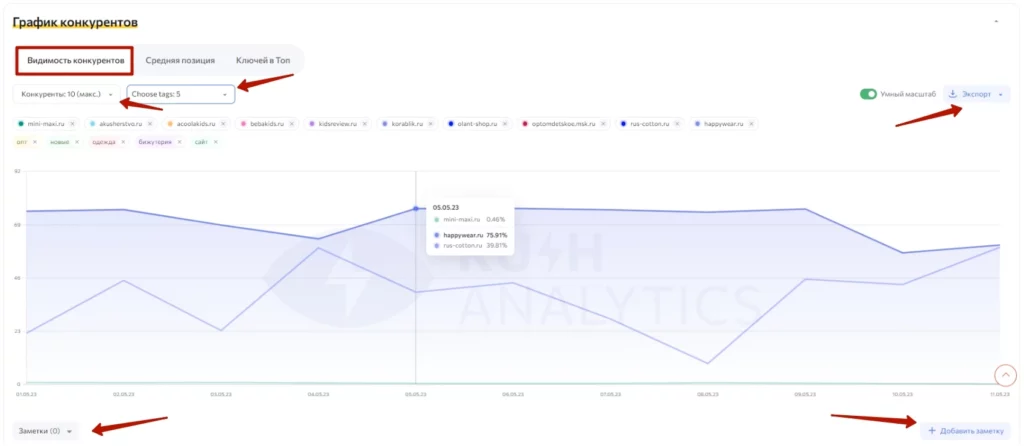
Visibility for tags is stored for the last 2 years.
- Average position – You can display the desired number of regions on the chart; add notes, and download a report in PNG or PDF format:
- Keywords in TOP 10 – Filters to select region and TOP, add notes:
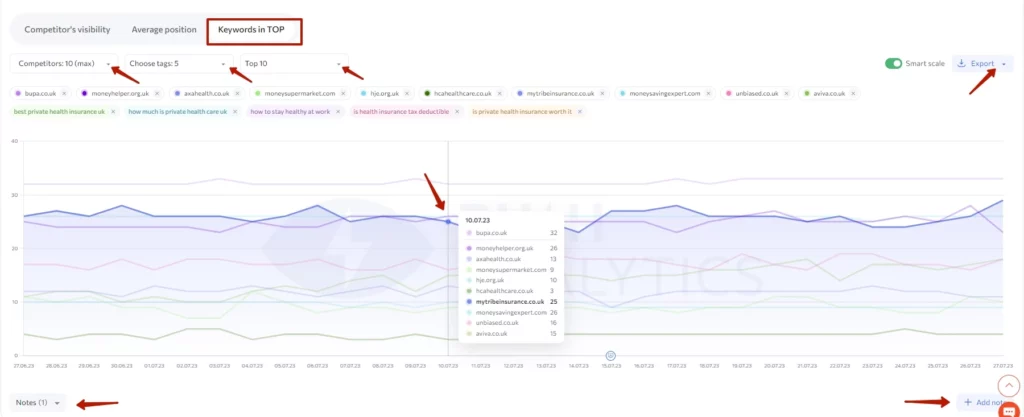
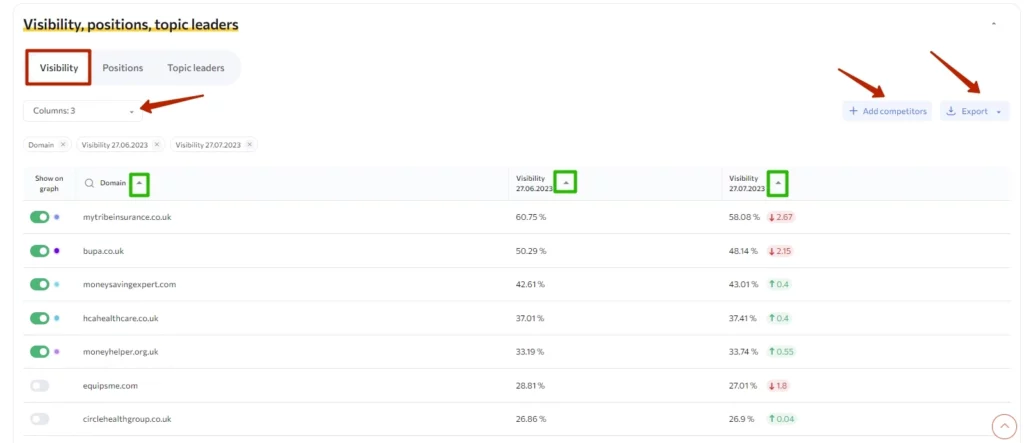
Competitor tables:
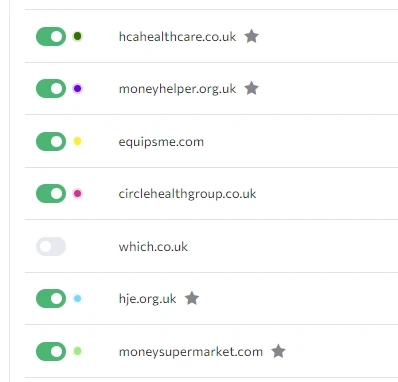
- Visibility – The competitor is displayed on the chart if the switch is in active mode. Same here, maximum 9 competitors + your site at the same time are available, add competitors to track (will be marked with an asterisk in the table, download reports in .XLSX or .CSV format, add notes, delete/add keywords:
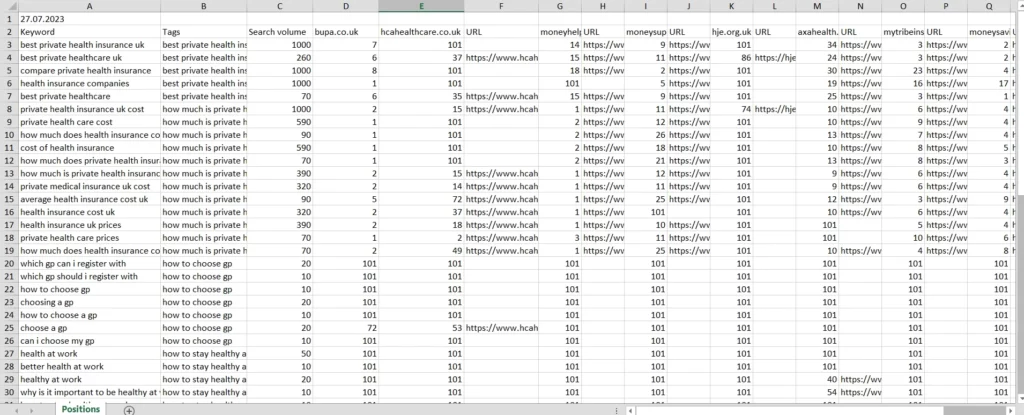
- Positions – You can display the positions of monitored competitors (marked with an asterisk) and search volume by specific tags in a table, and download reports in .XLSX or CSV format:
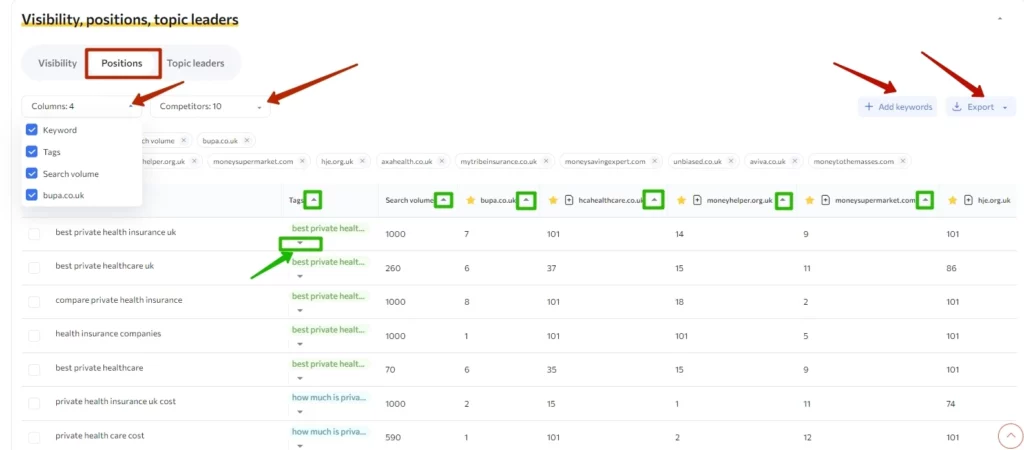
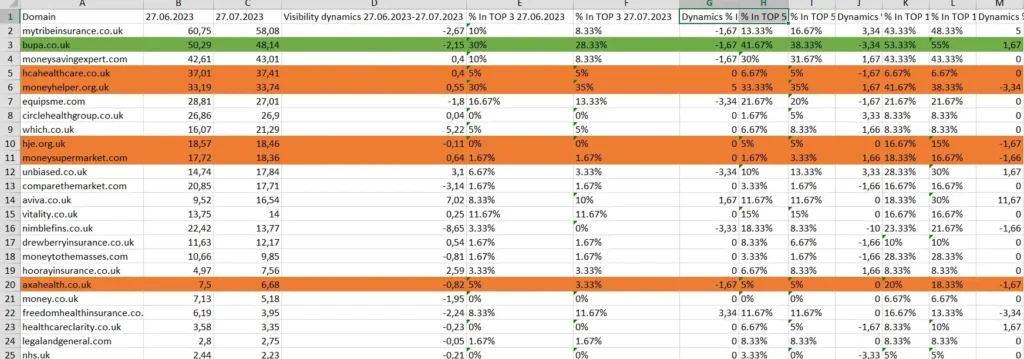
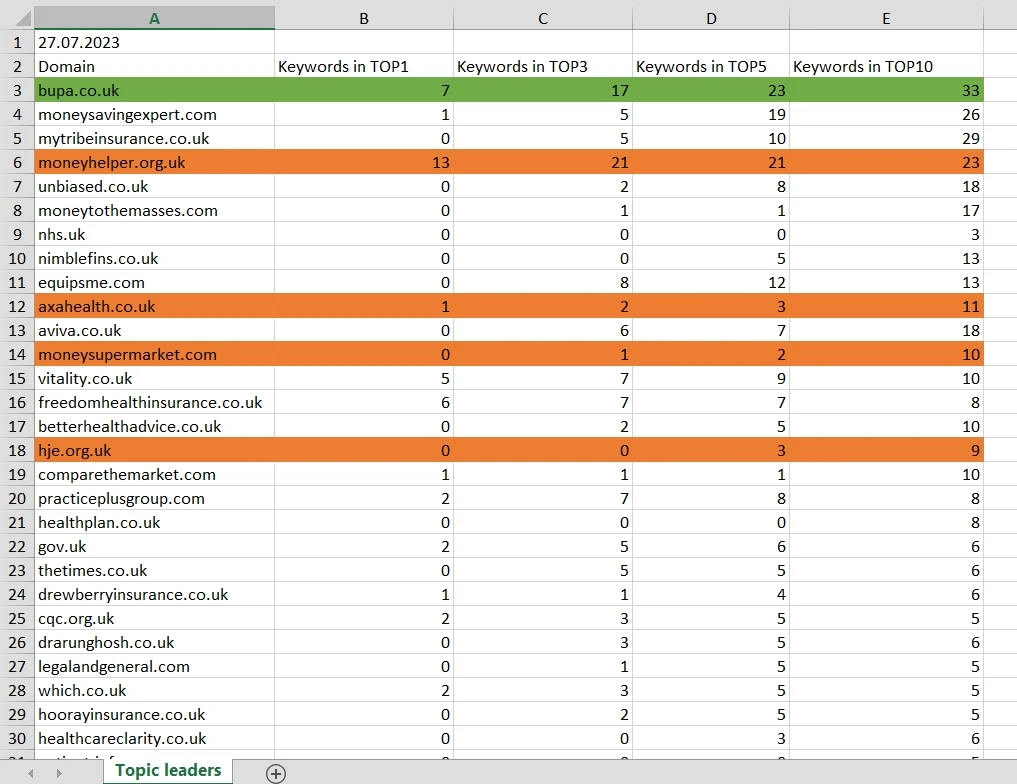
Topic leaders – You can see the number of keywords in the TOP 1, 3, 5, or 10 on the selected competitors (you can display a maximum of 10 at a time in the table). If specific competitors were added for tracking when creating the task or afterwards, they will be marked with an asterisk.
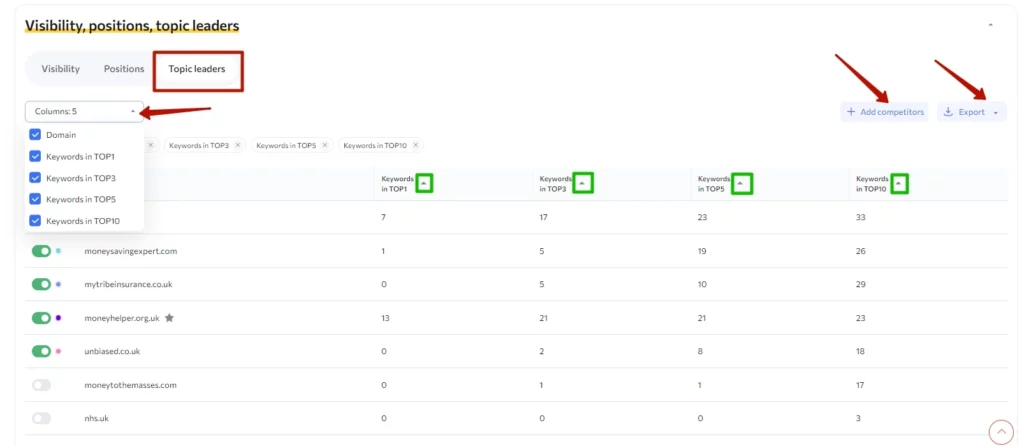
Also, you can download reports on competitors’ positions in .XLSX or .CSV format:
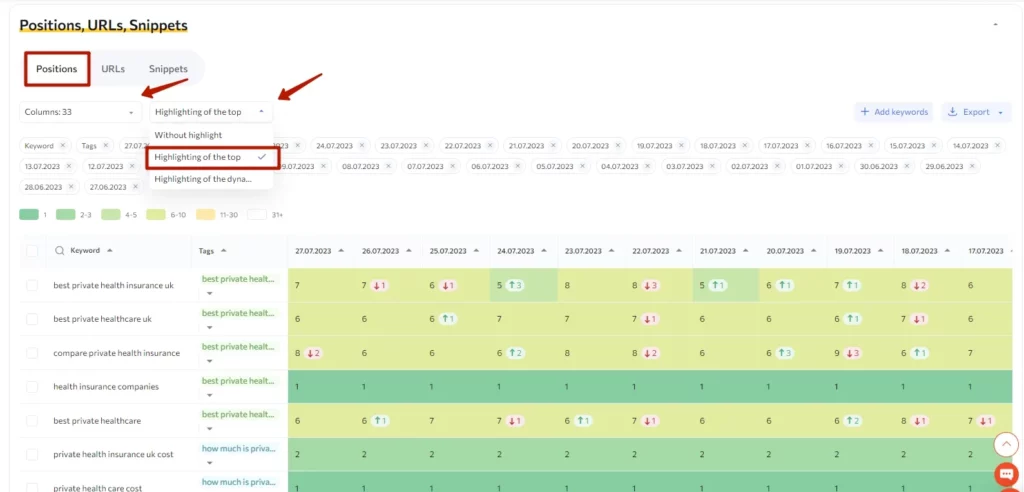
4. The History tab and related – You can set up what data to display with filters on the columns in the table, select the highlighting of the top and the dynamics, download reports in XLSX or SCV format, and add / delete keywords. It also contains:
- positions – Shows 1 month by default, but there is no limit to the number of dates of withdrawal of positions.
When you select highlighting of the TOP, the table will display data by position, marked with colors depending on the position.
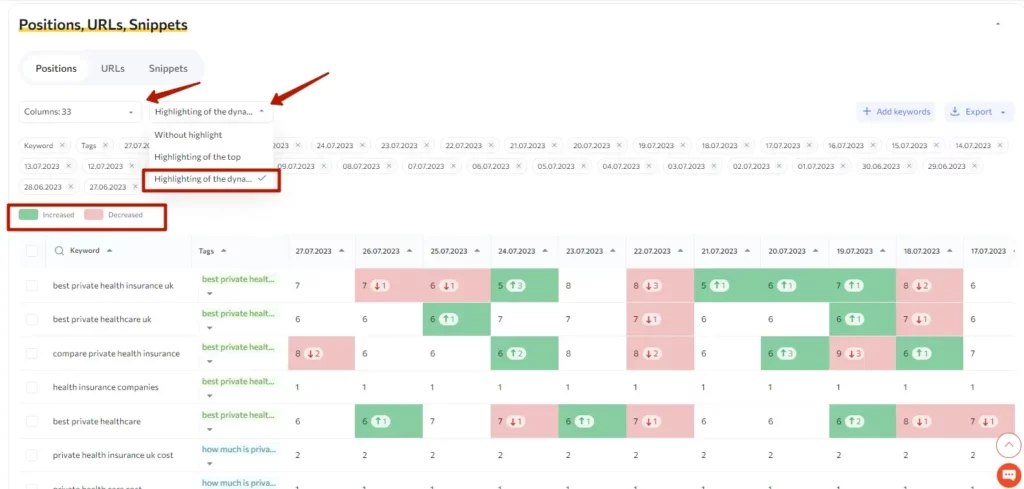
If you select highlighting of the dynamic, the table will display data on positions marked in color, depending on whether the position has increased in relation to the previous date of parsing or not:
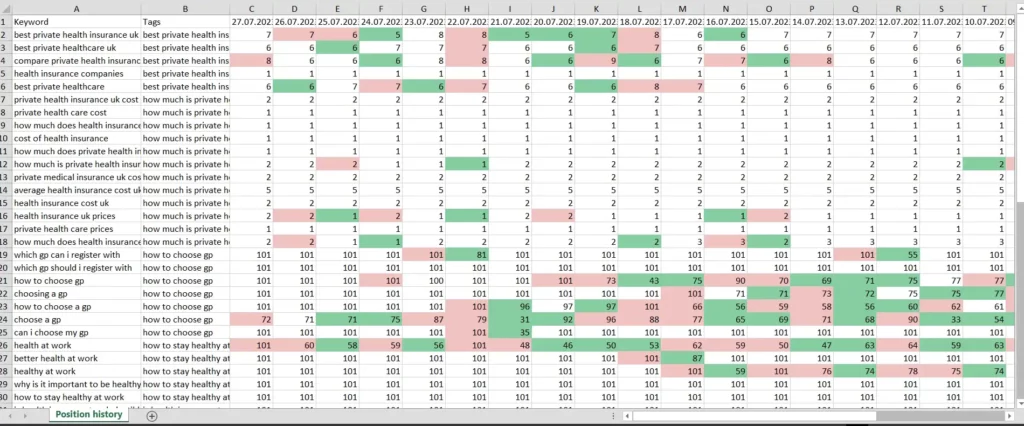
You can download reports in .XLSX or .CSV format, with or without highlighting:
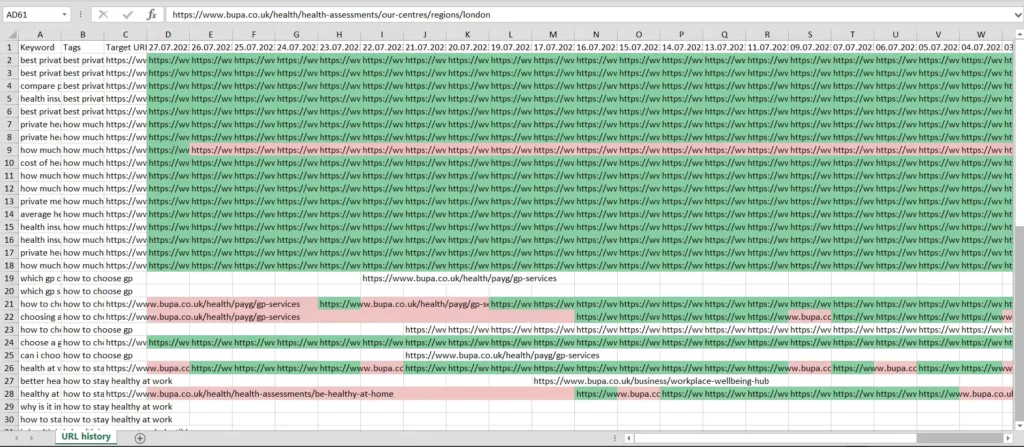
- URLs – There are filters by column in the table, and highlighting of the target URL like the previous one.
You can display the history of URLs without limitation on the number of dates.
It shows them for 1 month by default.
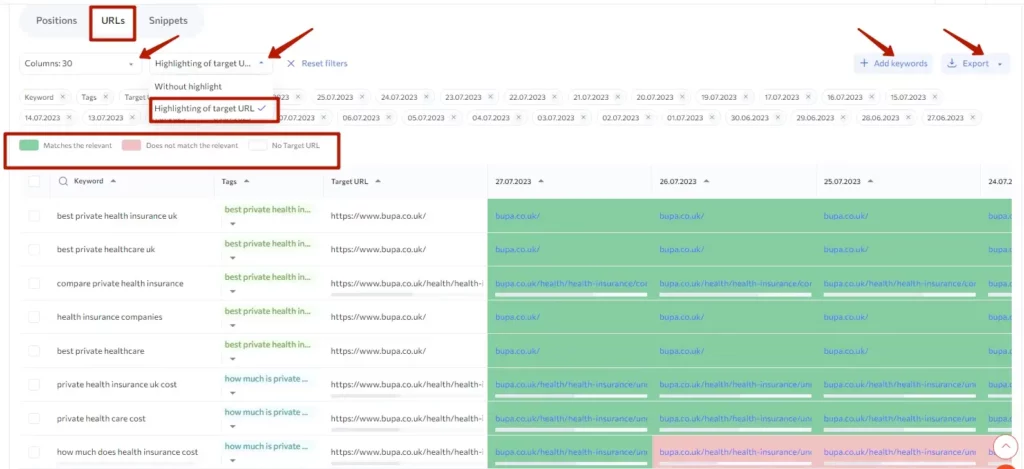
Get reports on the collected relevant URLs in .XLSX or .CSV format:
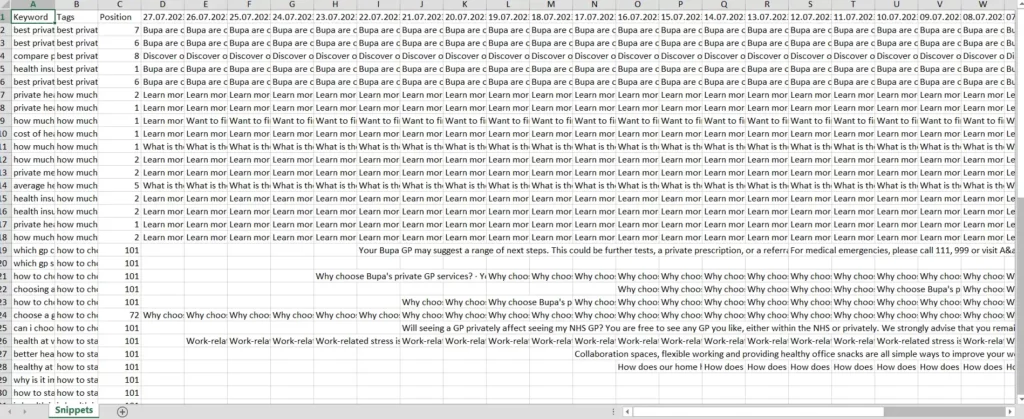
- Snippets – Snippet data by default for 1 month, no limitations on the number of dates. It is possible to filter displayed data.
Snippet report in .XLSX or .CSV format:
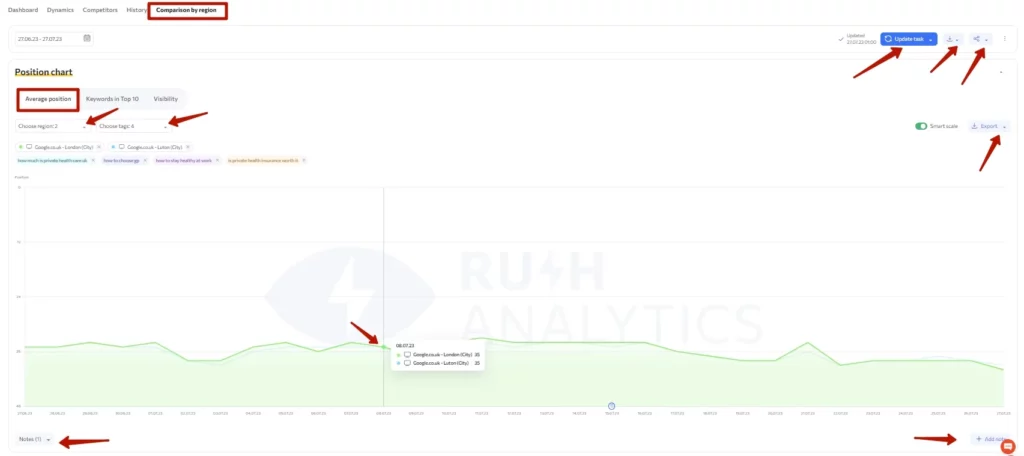
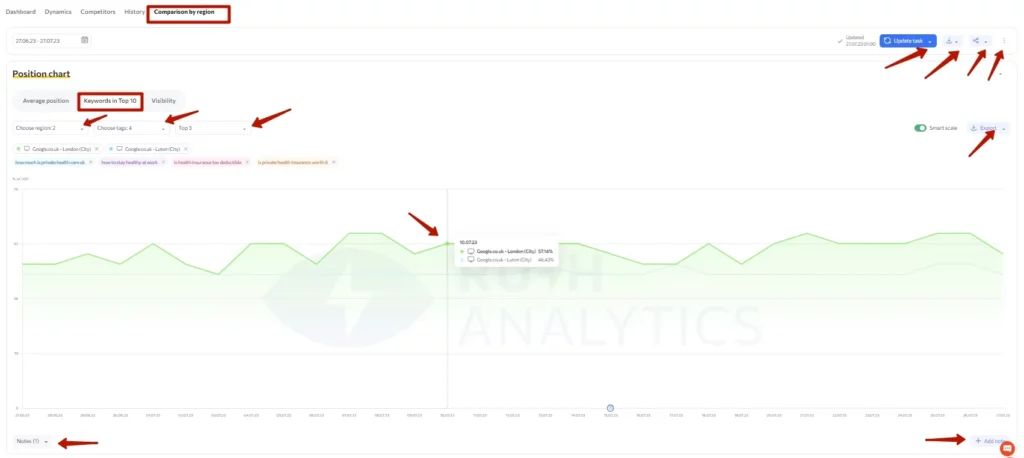
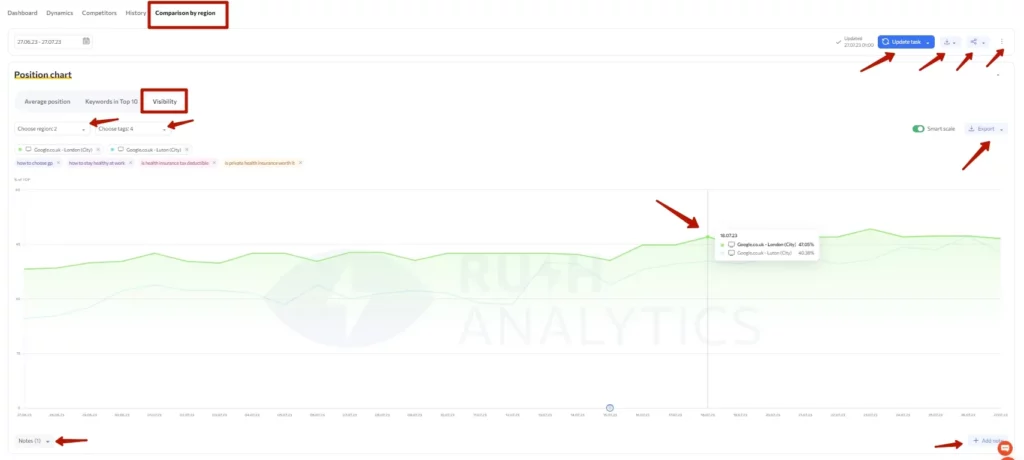
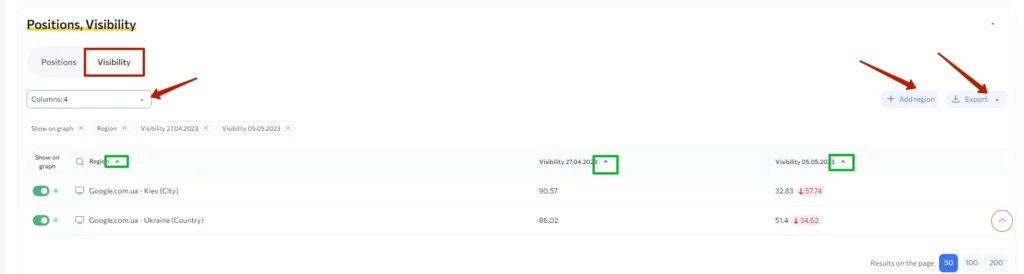
5. The tab Comparison by region and related – You can configure what data to output with filters, and download reports. It also contains:
Position chart:
- Average position – You can display the desired number of regions on the chart, add notes, and download a report in PNG or PDF format:
- Keywords in TOP 10 – Filters to select region and top, add notes:
- visibility – Region selection filters, add notes:
Tables:
- Positions – Keywords and positions of the selected regions:
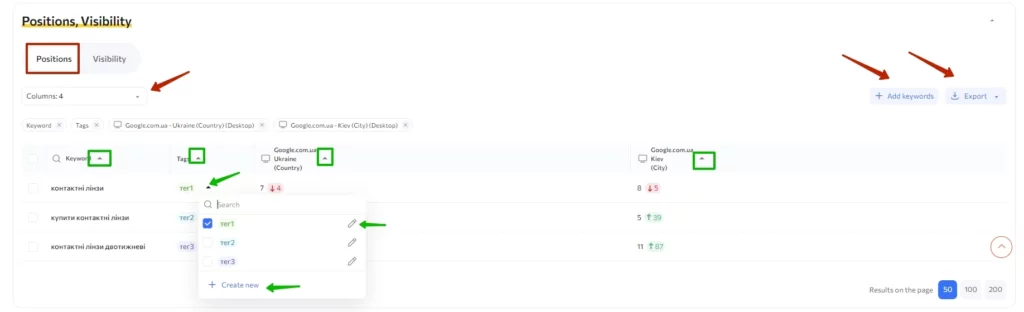
Get a report in XLSX or CSV format:
- Visibility – You can filter output data, such as keywords, regions; add/remove keywords; and download reports in .XLSX or .SCV format.
A guide to working with task editing
Step one: General Information:
- Change the name of the task
- Specify a new URL
- Check the availability/change the functionality option to expert
- Enter domains of your competitors to track – up to 10 domains
- Change the frequency of checking positions
- Change the frequency of search volume
- Connect Yandex Metric or Google Search Console
Step two: Search engines
- You can add and delete regions here
Step three: Keywords and pricing
- You can add keywords to the task by list or via file
- You can create/delete/edit tags (title) – search is available
- You can assign up to 10 tags to one keyword
- Remove selected keywords – search is available
- You can add a target URL to the task, remove or edit an existing one – search is available
- Add/update data using a Keyword/URL/Tag file without losing history
How to update tags or URLs on existing keywords without losing history and/or adding new keywords with data at the same time.
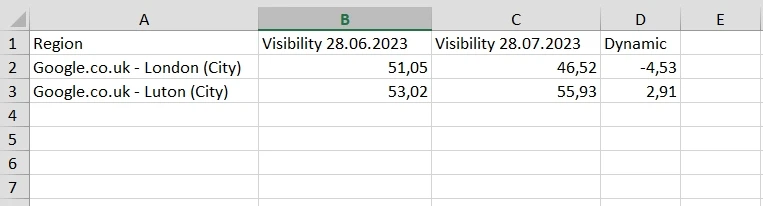
- Download the report with the necessary data on keywords, URLs and tags
- Generate a new report with the data you already have, in the Keyword/URL/Group format (it is better to create a new file – XLSX or CSV format)
- Add your list of keywords in the “A” column
- Specify the target URLs in the “B” column
- List the names of the tags (separated by comma and space, if you want to assign several tags to one query – max 10) in the “C” column
- Then add new keywords (and URLs with tags if needed).
- Where there are no tags or URLs, leave a column/row blank opposite the keywords
- Check format: KEYWORDS | URL | TAG
- Upload file
- As a result, the information will be updated for the old keywords (if you edited URLs and tags), and new data will be added. Save it.
Then, the history of existing keywords will be saved. If nothing has changed, it will remain, but with the history. New keywords with data will be added.
If the data has been edited, you should update the task after saving it, so that the new information will be pulled up: the system will collect URLs relevant to the keywords and show them in color, depending on whether they coincide with the specified keywords or not. Also, it will collect positions for new keywords.
Terminology:
- Keyword – The keywords you uploaded to the task
- Tags – Created tags (groups/clusters) for keywords
- Relevant URL – Collected by the system automatically from search results and matching the keywords
- Target URL – The specified URL, which will be compared with the relevant one
Is this article helpful?
 422
422
 0
0