


We could say that measuring page views, users, and sessions in Google Analytics are the 3 metrics that can be most useful, however, their meaning can be confusing. Google Analytics gives you a lot of data, and it can sometimes be difficult to understand the information correctly.
There is so much going on in your account and many metrics are tracked simultaneously. But from an SEO (search engine optimization) point of view, the most important metrics are users, sessions, and page views. If a blogger says that 2 million people visit your site per month, no one will believe him. But if he shows the Google Analytics graph indicating sessions, then he has something to back up that claim.
However, even then, this does not confirm that 2 million people have visited your site because there is a difference between users and sessions. Interestingly, there is a difference between the three most commonly used metrics to indicate traffic to your site, including sessions, users, and page views.
What are page views in Google Analytics?
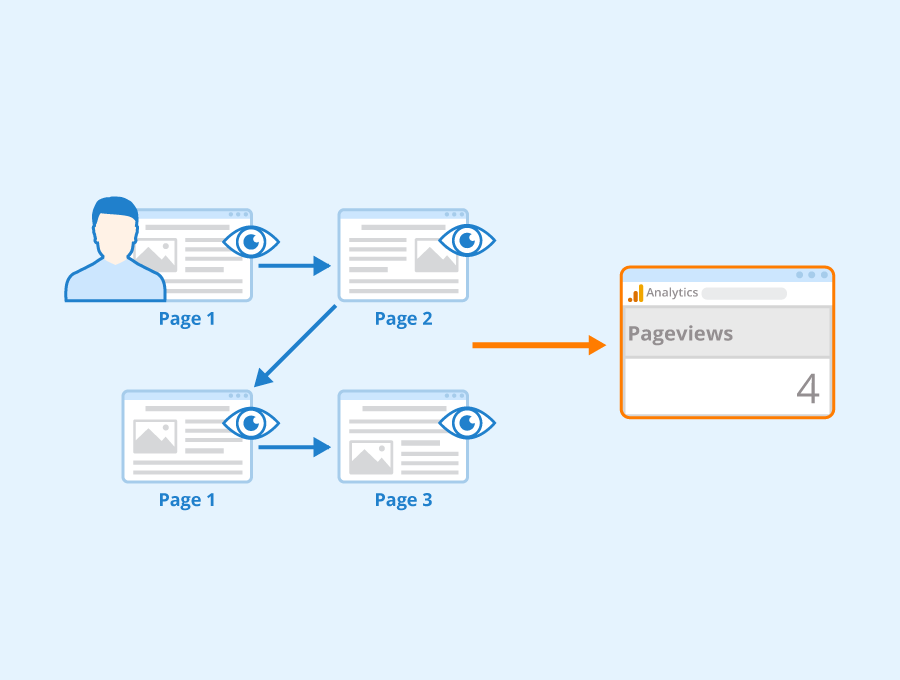
This is one of the easiest to understand. Page views are the total number of times the same page has been viewed on the website. Now, in case the same user clicks on the page multiple times, analytics will count each visit as a page view.
Why are page views important?
SEO services use page views for different purposes, other than, of course, knowing how many people viewed your site that particular day, week, or month. An analysis of page views usually indicates whether your new page design or the online advertising campaign you are running is performing to your expectations or not.
The best way to understand it is to track number of page views before improving your website design and content or implementing new marketing strategies. Get Google Analytics data related to page views and then make changes or update your website in any way you want.
In case the number of page views increase, it means that the changes you made are working, and you can retain them or continue with the advertising campaign. However, in case of page views go down, you would prefer to go back to the original design or content of the site. In this way, page views can be used as a benchmark to judge whether your new updates will work or not.
Importance of web statistics
These metrics are really of great importance as they tell you about user engagement: how many users visit your site, the users who keep coming back several times, the amount of time a visitor stays on particular page, and also who your new users are.
It is always better to have many return visitors who participate in multiple sessions rather than those users who view multiple pages and do not return or stay for an extended time on your site. This particular information related to sessions, page views, and users provided by the Google Analytics account is very useful for SEO consulting services looking to improve lead generation opportunities, and when redesigning your website looking for better results and traffic.
These metrics help measure visitor behavior – the reach of the landing pages and the areas that need further improvement.
How to sign up for Google Analytics
If you still don’t have Google Analytics on your account, you have to get one. First of all, you need a Google account.
- Sign in with Google
- Click on the top right
- On the homepage of the search engine, there is a blue button (top right) on which you click to do this. If you don’t have an account yet, you have to register first: click on More options and then on Create account. Then fill out the form fields, accept the terms of use and finally check whether the confirmation arrives in your (email) inbox.
There you must now create an account for the visitor counter. So once again fill out all the form fields, enter the URL of the website, select the industry and be sure to set the correct time zone. After that, you will be shown the tracking ID and the tracking code. The ID or the code must now only be entered on your website.
If you use WordPress, it is best to use the plugin Google Analytics Dashboard, which has even more advantages.
Alternatively, you can also write the tracking code in the head area of the website. But with the plugin it is easier, there is a field where you only need to copy the ID (click on Google Analytics in the Dashboard and then on Tracking Code). If the Google Analytics account is still fresh, it takes a few days until the first statistics are callable.
- Home page
On the Google Analytics page, you can already find the first statistics – here’s the overview report you can research. There is the menu bar on the left with which all categories can be accessed. The start page overview is suitable for cursory evaluations of the traffic.
In the first window with the curve diagram, click on Target group overview. You will see the core figures that you should compare regularly.
NExt to the window there is another chart that shows the ratio of new and returning visitors. Many returning visitors are a quality index for Google.
- Compare periods
At the top right, you can click on the date to set the period. A menu with a calendar opens, where the easily overlooked sub-item Compare With is also hidden. This way you can compare periods with each other, and easily see how the numbers change.
Put a checkmark in Compare within the upper right-hand corner.
- Target audience
On the left side of the menu, you will find the sub-items of Target Audience. The Google Beuscher counter knows so much about user behavior that we cannot discuss all aspects in detail today. Nevertheless, you should know what is behind the menu items. The following statics are understandable:
- Demographic characteristics: Who are your users
- Interests: What are the visitors of the website interested in (essential for ads)
- Geography: Where users come from
- Behavior: Do users come regularly
- Technology: What browsers and operating systems are used
- Mobile: Do we visit the site more on tablets, smartphones, or desktop PCs?
- Personalized: You can even set your variables here
If you check this chart regularly, you’ll find out how you can better manage your website visitors.
- Acquisition
Next, let’s look at visitor sources. You can get there by clicking on Acquisition and Overview in the menu bar.
Get 7 days free trial access to all tools.
No credit card needed!

You can use Google Analytics to know the most visited pages of your website
Imagine you have a blog and you have created for a menu in your header a series of sections such as Essential tools, Free resources, Subscribe, and Who I am. Wouldn’t it be great to know which sections are most visited when someone enters our page? Learning this is very easy thanks to Google Analytics’ goals.
How to create goals in Google Analytics
Log into your Google Analytics account, go to the “Administrator” section and look for “Goals” in the third column of Google Analytics page. Inside, you will see the option to “Create a goal” in red.
The next step is to set up a goal, for which you will select the “Custom” option. Give your target a name that allows you to identify it easily and then choose the type “Destination” and click next.
The next and last step is where you must complete all the information of our goal, which in this case is that the user enters one of the sections we have mentioned. Thus, in “Destination”, we must introduce as “equal to” the URL of one of the sections.
If the section you have created has a monetary value for each visit (for example if you sell an ebook) you can enter the value. Finally, you can activate the conversion funnels option if there were several steps but this time the user goes from the home page to the section in question, which is the final page of our goal, so it is not necessary.
When you have already created a goal for the first section, it would simply be necessary to repeat the process for the rest of the sections. This simple way, in the target section, you will be able to see the users that come to your website and visit some of these sections in the first place. This can help you to determine which one generates more interest and thus boost your content, including affiliate links and internal links. It can also help you to make changes in the title of the section with less performance to see if you get more traffic with a new and more attractive title.
Conclusion
Google Analytics offers a whole range of options for adapting your analytics account to your needs. In addition to the settings mentioned above, there are numerous other adjustments that you can make in order to track other metrics. This allows you to find page views amount and work optimally with your data while maintaining an overview and quickly recognizing possible problems.


